
Talking Points:
– The Federal Reserve hiked rates at today’s rate decision for the second time in 2018, and the seventh such hike since this rising rate cycle began in December, 2015. The Fed also forecasted an additional two rate hikes in 2018, and while this drove an initial move of USD-strength, prices quickly pulled back as a plethora of headline risk remains on the calendar for the remainder of this week.
– FX market participants’ focus now shifts to the European Central Bank rate decision on the calendar for tomorrow morning. The big item of interest there is whether the ECB begins to roll-out details on how they may look to begin to gradually exit from their QE program, currently set to end in September of 2018.
– DailyFX Forecasts on a variety of currencies such as the US Dollar or the Euro are available from the DailyFX Trading Guides page. If you’re looking to improve your trading approach, check out Traits of Successful Traders. And if you’re looking for an introductory primer to the Forex market, check out our New to FX Guide.
Do you want to see how retail traders are currently trading the US Dollar? Check out our IG Client Sentiment Indicator.
Fed Hikes, Forecasts Two More for 2018
In a widely-expected move, the Federal Reserve hiked rates at today’s meeting, making for the second such move so far in 2018. This marks the seventh hike since this cycle began in December of 2015, and the Fed opened the door for an additional two moves in 2018 as read from the dot plot matrix. There were a few other changes of note at today’s meeting, which we’ll discuss below, but the immediate response across FX markets was a quick move of US Dollar strength after the currency spent the earlier part of the day selling-off. Prices found support at the bottom of a bullish channel just ahead of the Fed’s statement, and as news of this rate hike permeated through markets DXY bumped back-up to the 94.00 level, at which point that move of strength started to soften.
US Dollar via ‘DXY’ 30-Minute Chart: Rip, then Dip on FOMC
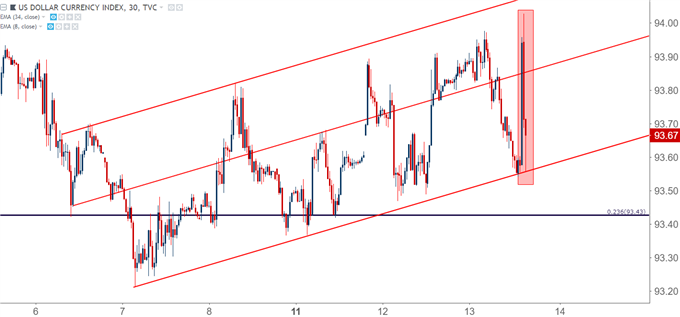
Chart prepared by James Stanley
On a longer-term basis, this bullish channel remains as a potential bear flag formation. Earlier today, we looked at how the 23.6% retracement of the recent bullish move in USD has helped the Greenback to carve-out support over the past week and a half.
US Dollar Four-Hour Chart: Bullish Channel Retains Bear Flag Potential
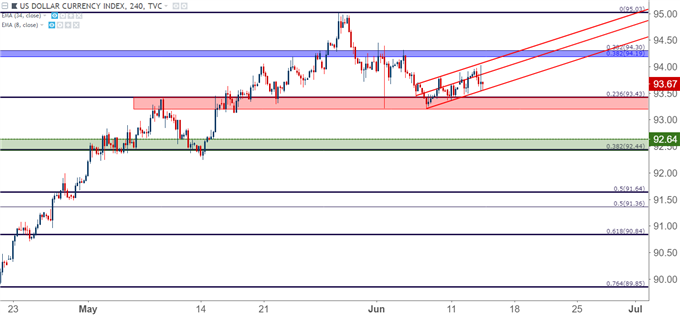
Chart prepared by James Stanley
Additional Details
The shift to four rate hikes expected out of the Fed this year was not without cost, as the bank essentially jostled longer-term expectations. Coming into today’s rate decision, the bank was looking for a total of three hikes this year, three hikes for 2019 and two for 2020. With today’s modification, one of the hikes that was previously expected in 2020 has been moved to this year, as the Fed is now forecasting a total of four hikes in 2018, the same three hikes in 2018 and now only one hike in 2020. So the terminal rate remains the same, but the speed at which the Fed is looking to hike rates appears to have hastened.
Also of interest: The Fed is looking to address the quandary of forward guidance. This was something that was emphasized in 2011 as the bank was looking to further restore confidence in the US financial system. The thought being, if the Fed told market participants that rates would stay low for the next two or three years, that could motivate risk taking.
But now that we’re well-entrenched in a rising rate cycle, does that same forward guidance provide the same element of benefit? Rather than communicating to market participants that the economic backdrop will remain friendly, it instead warns of oncoming tighter conditions. This will be addressed next year in two ways: The Fed will now remove forward guidance from their statements starting in January of next year, and the bank will now also accompany every FOMC rate decision with an accompanying press conference. This doubles the number of meetings each year, taking the current total of five up to a total of ten.
US Inflation Remains Brisk
As we move deeper into the year, the focus remains on US inflation, which hit a fresh one-year high in May. Perhaps more importantly, the May inflation print marked the ninth consecutive month that inflation has printed at-or-above the Fed’s 2% target, seemingly keeping the door open for a hawkish Fed as we move into the second half of the year.
US CPI At-Or-Above Target for Nine Consecutive Months, One-Year Highs in May
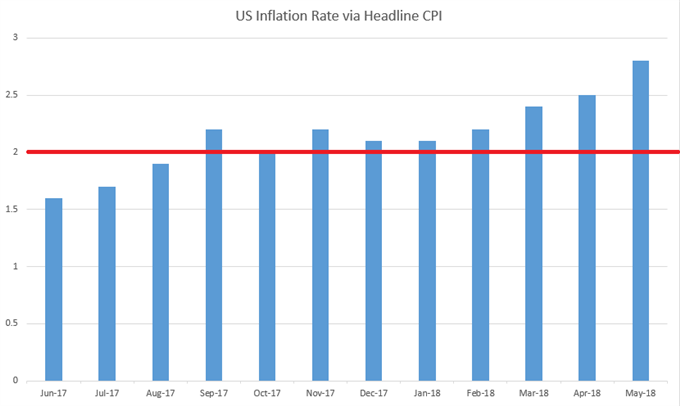
Chart prepared by James Stanley
The Big Question: Is the 2017 Down-Trend in the US Dollar Done?
The Fed as one of the most hawkish Central Banks in the world isn’t a new thing, as this remained fairly prominent throughout 2017. This also exposes the bank, and the US Dollar, as one of the few Central Bank’s tightening rates. But despite this deviation, the US Dollar spent almost the entirety of last year mired in a rather aggressive down-trend; retracing 61.8% of the 2014-2017 major move. The likely driver here was capital flows moving towards Europe and the Euro, likely in anticipation of the ECB eventually moving away from their own QE program. That theme is center stage tomorrow morning at the ECB’s June rate decision, in which we’ve already heard from multiple ECB members that the bank will begin talking about gradually exiting their QE program.
US Dollar Weekly Chart: Support at 61.8% Retracement of 2014-2017 Move, Resistance at 38.2%
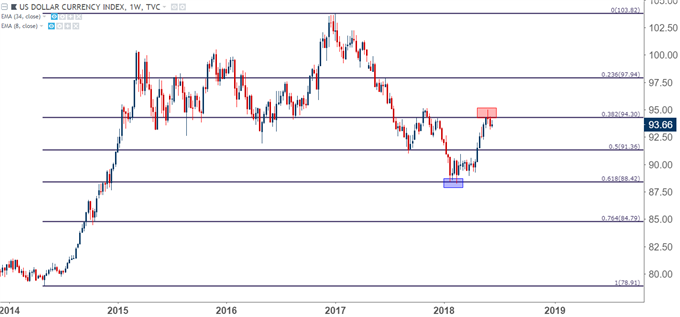
Chart prepared by James Stanley
EUR/USD Bounces From Support Zone After FOMC
Going along with that quick blip of USD-strength was a quick move of EUR/USD weakness. The pair dipped-down into the longer-term zone of support that we’ve been following that runs from 1.1685-1.1736, but buyers quickly stepped-in to push prices right back to where we were ahead of FOMC. This retains the descending wedge formation in EUR/USD as we approach tomorrow’s ECB rate decision.
EUR/USD Hourly Chart: Dip to Support Met with Buyers, Descending Wedge Remains
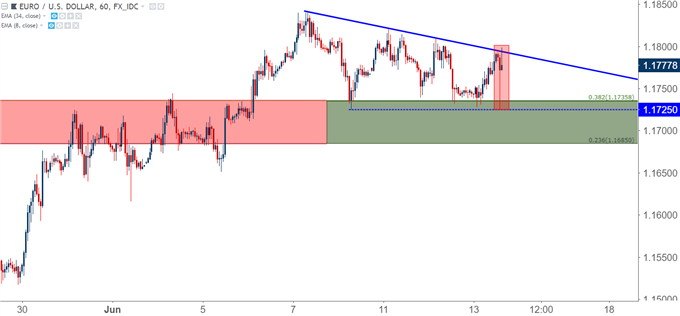
Chart prepared by James Stanley
USD/JPY Sets Fresh June High, Pulls Back Ahead of BoJ
Not to be lost on the shuffle, we have a Bank of Japan rate decision on the cards for Thursday evening/Friday morning; and the door appears open for the BoJ to retain a dovish stance as inflation has continued to fall in Japan. The pair had previously reversed a bullish trend in late-May, largely on the apparent basis of the US-North Korea summit having been called-off. But as that scenario settled until, eventually, we saw the initial stages of positive resolution, USD/JPY has started to tilt-higher, running back-above the 110.00 psychological level. the longer-term zone of support that we’ve been following, and the potential for bullish continuation in USD/JPY remains as we move deeper into this week.
USD/JPY Four-Hour Chart: Fresh June Highs After FOMC, Bullish Continuation Potential
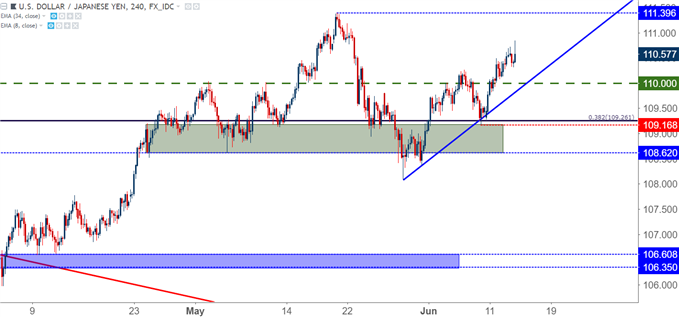
Chart prepared by James Stanley
To read more:
Are you looking for longer-term analysis on the U.S. Dollar? Our DailyFX Forecasts for Q1 have a section for each major currency, and we also offer a plethora of resources on USD-pairs such as EUR/USD, GBP/USD, USD/JPY, AUD/USD. Traders can also stay up with near-term positioning via our IG Client Sentiment Indicator.
Forex Trading Resources
DailyFX offers a plethora of tools, indicators and resources to help traders. For those looking for trading ideas, our IG Client Sentiment shows the positioning of retail traders with actual live trades and positions. Our trading guides bring our DailyFX Quarterly Forecasts and our Top Trading Opportunities; and our real-time news feed has intra-day interactions from the DailyFX team. And if you’re looking for real-time analysis, our DailyFX Webinars offer numerous sessions each week in which you can see how and why we’re looking at what we’re looking at.
If you’re looking for educational information, our New to FX guide is there to help new(er) traders while our Traits of Successful Traders research is built to help sharpen the skill set by focusing on risk and trade management.
— Written by James Stanley, Strategist for DailyFX.com
Contact and follow James on Twitter: @JStanleyFX