Bitcoin, Ripple, Ether, Litecoin – Charts, Prices and News
– Japanese FSA crackdown, bitFlyer suspends new account openings.
– Losses paint a very negative technical picture.
Cryptocurrency Market Slumps on Japanese FSA Actions
Six of Japan’s largest regulated cryptocurrency exchanges have been told to improve their internal auditing and customer identification processes by the FSA, prompting the country’s largest exchange, bitFlyer, to suspend new account openings. The actions come on the back of an inquiry thta started back in April after domestic exchange Coincheck revealed a $500 million hack. Coincheck subsequently covered client losses.
The announcement come on the back of increased scrutiny from the US SEC into whether or not various cryptocurrencies should be classified as securities or not, a potentially fatal move for many ICOs.
The market slumped on Friday after a side-ways trading week and the charts now show a weak landscape for many tokens. Levels that were previously seen as strong support have now turned into short-term resistance and will make any rebound difficult.
To see how retail traders are currently positioned in cryptocurrencies and what it means for the market sentiment and set-ups looking forward, see the IG Client Sentimentpage.
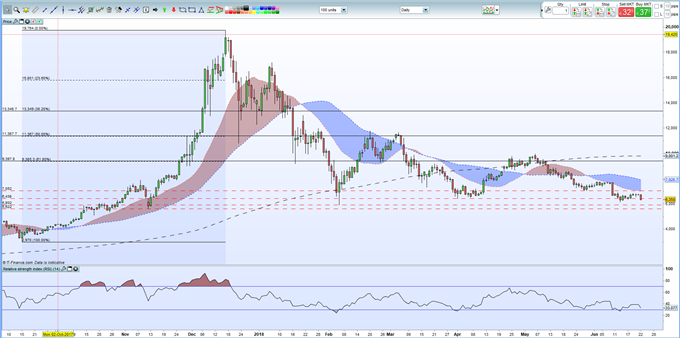
Bitcoin to Fall Below $6,000
Bitcoin’s fall has seen it push through recent support levels and is on course to trade back below $6,000. BTC trades below all three moving averages, a negative chart set-up. Initial support is provided by the February 6 low at $5,932 ahead of the November 12 swing low at $5,622. Any rally will be met by weak resistance at $6,438 before stronger resistance at $7,052.
Bitcoin (BTC) Daily Price Chart in US Dollars (October 2017 – June 22, 2018)

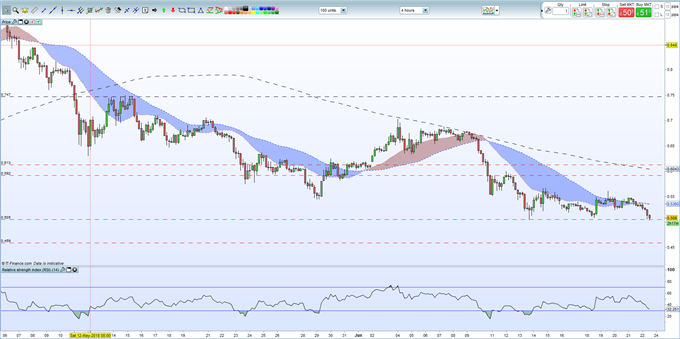
Ripple Down 25% in the Last Month
Ripple continues to test the June 13 low at $0.515 and a clean break and close below here opens up $0.46 ahead of a much sharper sell-off down to the start of the December – January rally around $0.20. Strong resistance between $0.59 and $0.61.
Ripple’s regulatory classification remains unanswered.
Ripple (XRP) Four Hour Price Chart in US Dollars (May – June 22, 2018)

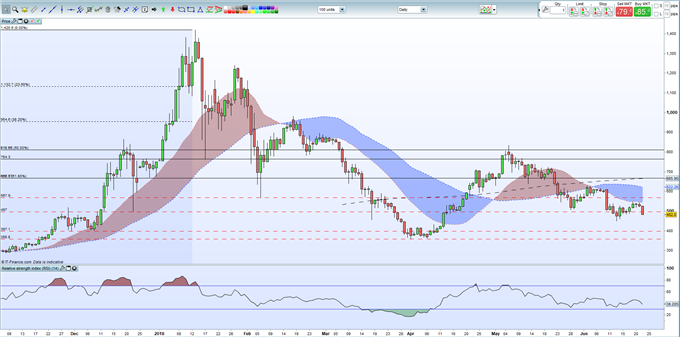
Ether’s Support at $500 Fades
ETH strong support at $497 has kept the outlook for the coin neutral in the past few weeks but today’s break below may lead to further losses. This now level now turns to resistance ahead of $566. To the downside, $453 may provide a brake ahead of larger falls back to $397 and $359 where strong support should be found. Technical set-up is weak – below all three moving averages – but the RSI is dipping into oversold territory.
Ethereum (ETH)Daily Price Chart in US Dollars (November 2017 – June 22, 2018)

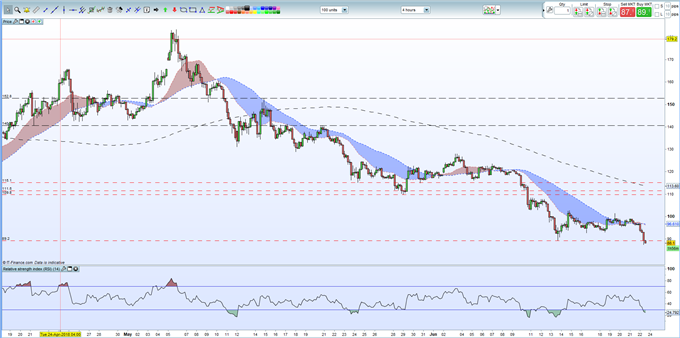
Litecoin Back at Pre-Rally Level
Litecoin is now trading just below the $90 level that started the December rally up to $380 and has no real support levels until the $55 area. Headway will be met with resistance between $109.8 and $115.1. The RSI indicator is now in oversold territory and may break the recent fall, but again the token is below all three moving averages.
Litecoin (LTC) Four Hour Price Chart in US Dollars (April 18 – June 22, 2018)

Essential Cryptocurrency Trader Resources
If you are interested in trading Bitcoin, Ripple, Ether or Litecoin we can offer you a wide range of free resources to help you. We have an Introduction to Bitcoin Trading Guide along with a Free Practice Account. In addition we run a Weekly Bitcoin Webinar and have an IG Bitcoin Sentiment Indicator to help you gauge the market and make more informed trading decisions.
What’s your view of the cryptocurrency market – oversold or overbought? You can leave your comments in the section below or you can contact the author by email at nicholas.cawley@ig.com or via Twitter @nickcawley1.
— Written by Nick Cawley, Analyst.