EUR/USD
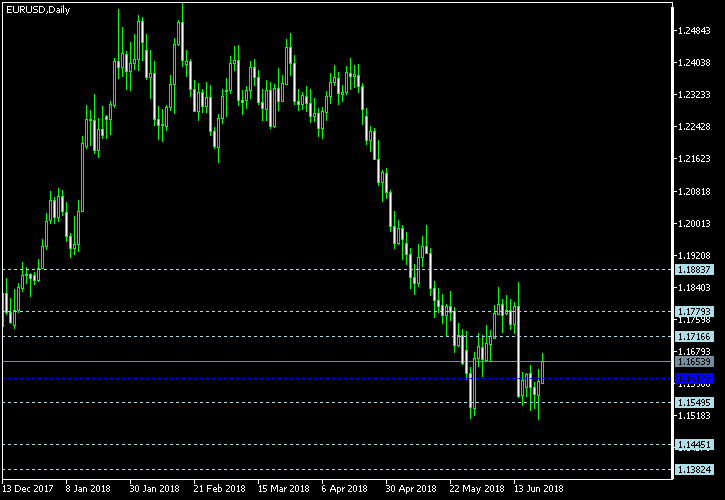
Floor pivot points
| 3rd Sup |
2nd Sup |
1st Sup |
Pivot |
1st Res |
2nd Res |
3rd Res |
|
| 1.1382 |
1.1445 |
1.1550 |
1.1612 |
1.1717 |
1.1779 |
1.1884 |

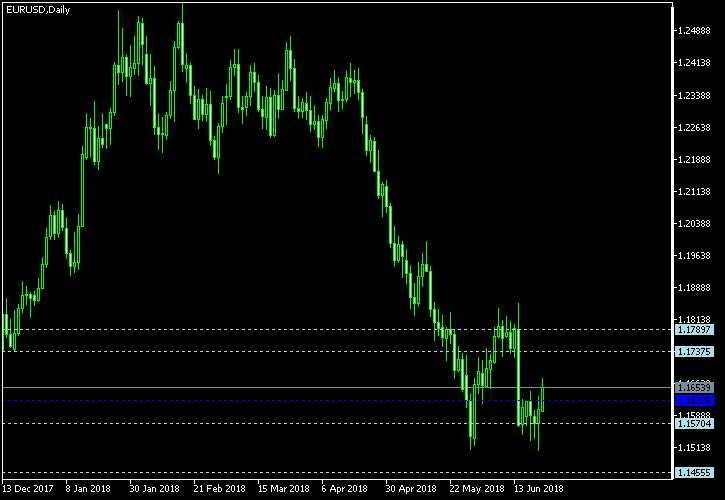
Woodie’s pivot points
| 2nd Sup |
1st Sup |
Pivot |
1st Res |
2nd Res |
| 1.1456 |
1.1570 |
1.1623 |
1.1737 |
1.1790 |
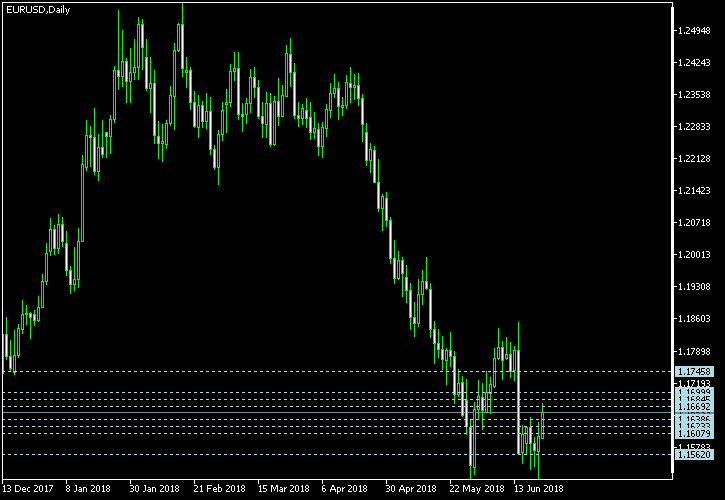
Camarilla pivot points
| 4th Sup |
3rd Sup |
2nd Sup |
1st Sup |
1st Res |
2nd Res |
3rd Res |
4th Res |
| 1.1562 |
1.1608 |
1.1623 |
1.1639 |
1.1669 |
1.1685 |
1.1700 |
1.1746 |
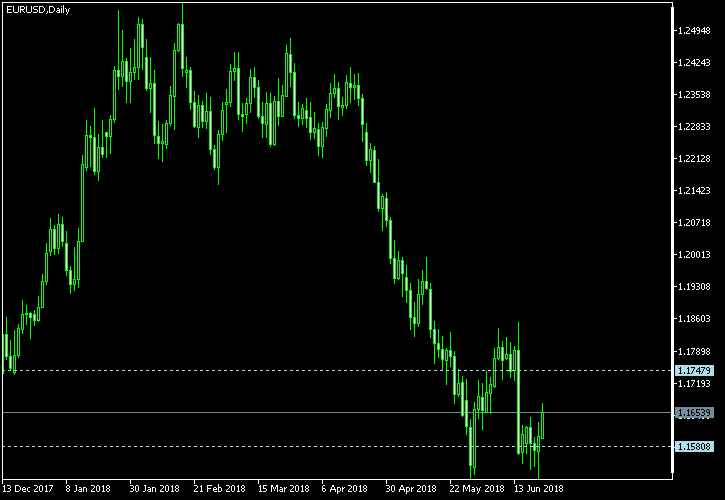
Tom Demark’s pivot points
| Support |
Resistance |
| 1.1581 |
1.1748 |
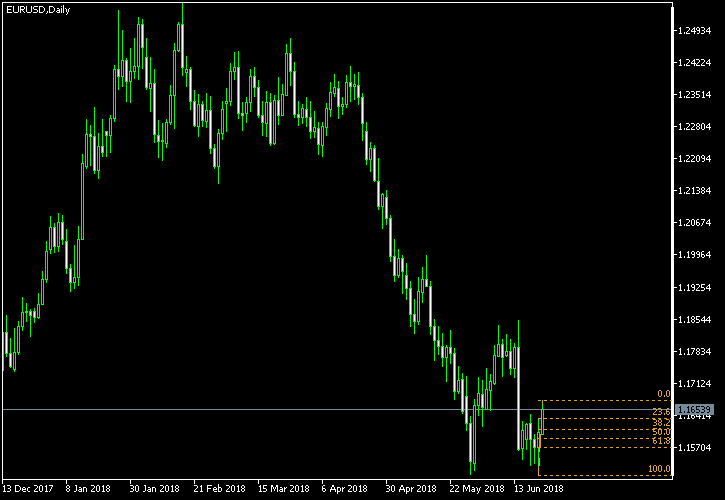
Fibonacci retracement levels
| 0.0% |
23.6% |
38.2% |
50.0% |
61.8% |
100.0% |
| 1.1508 |
1.1547 |
1.1572 |
1.1591 |
1.1611 |
1.1675 |
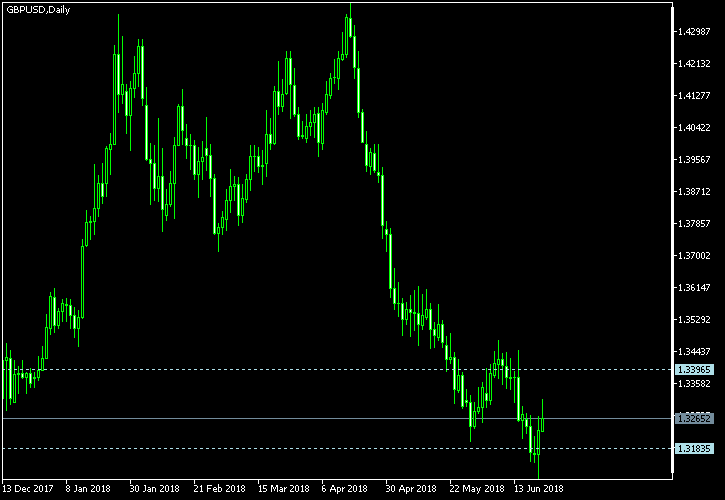
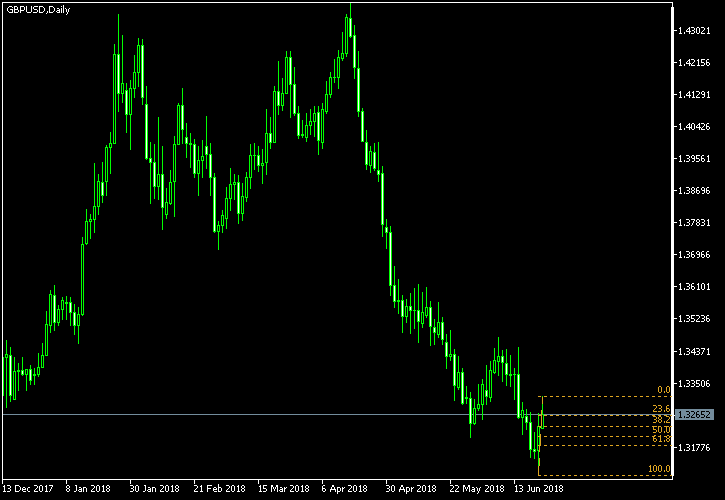
GBP/USD
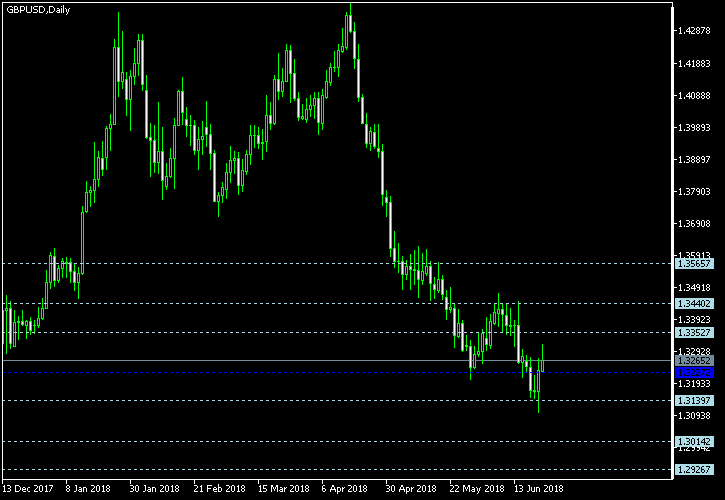
Floor pivot points
| 3rd Sup |
2nd Sup |
1st Sup |
Pivot |
1st Res |
2nd Res |
3rd Res |
|
| 1.2927 |
1.3014 |
1.3140 |
1.3227 |
1.3353 |
1.3440 |
1.3566 |
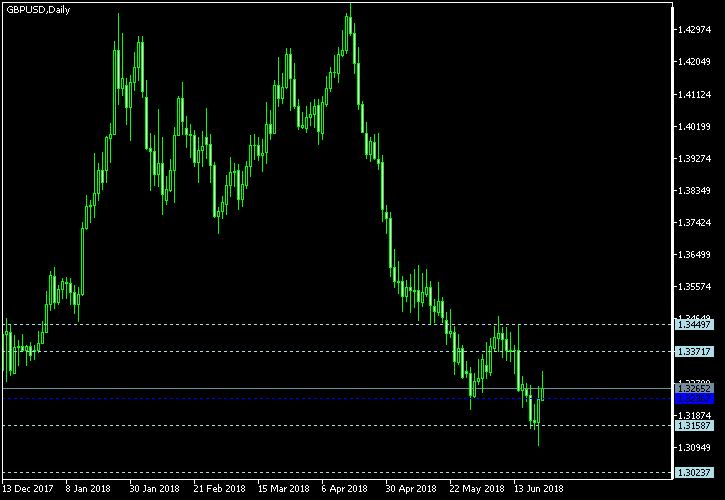
Woodie’s pivot points
| 2nd Sup |
1st Sup |
Pivot |
1st Res |
2nd Res |
| 1.3024 |
1.3159 |
1.3237 |
1.3372 |
1.3450 |
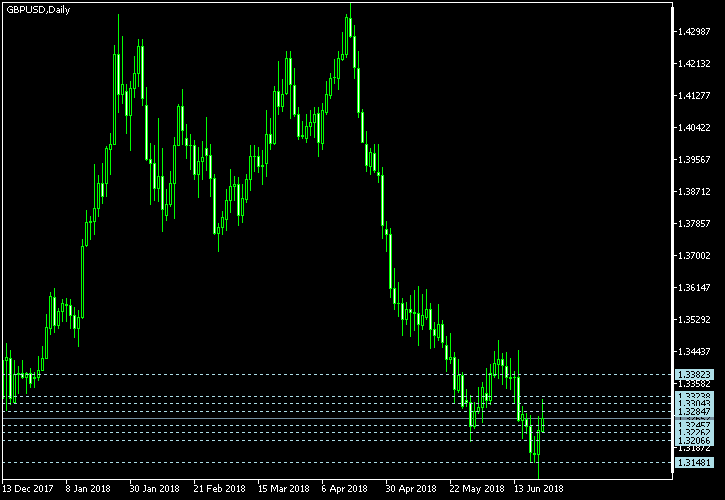
Camarilla pivot points
| 4th Sup |
3rd Sup |
2nd Sup |
1st Sup |
1st Res |
2nd Res |
3rd Res |
4th Res |
| 1.3148 |
1.3207 |
1.3226 |
1.3246 |
1.3285 |
1.3304 |
1.3324 |
1.3382 |
Tom Demark’s pivot points
| Support |
Resistance |
| 1.3183 |
1.3396 |
Fibonacci retracement levels
| 0.0% |
23.6% |
38.2% |
50.0% |
61.8% |
100.0% |
| 1.3102 |
1.3152 |
1.3183 |
1.3208 |
1.3233 |
1.3315 |
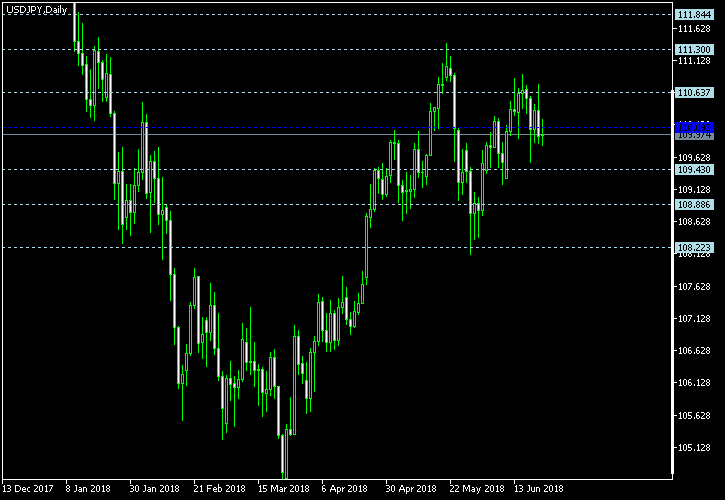
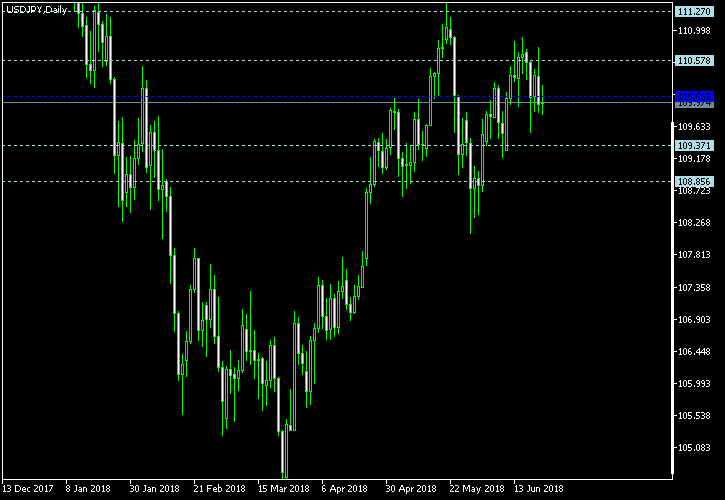
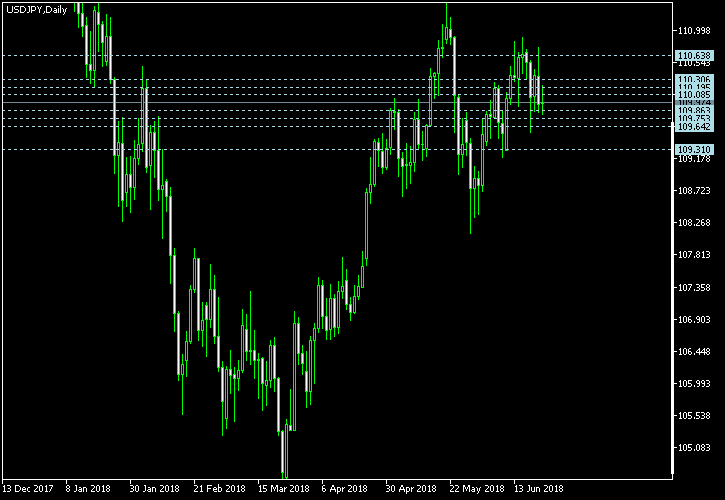
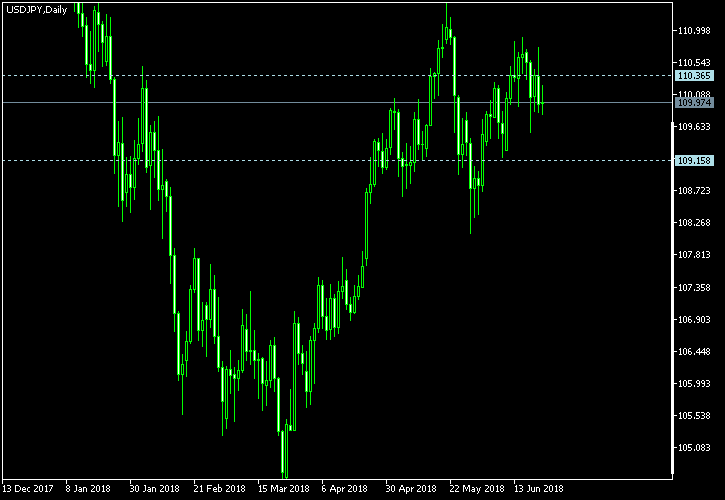
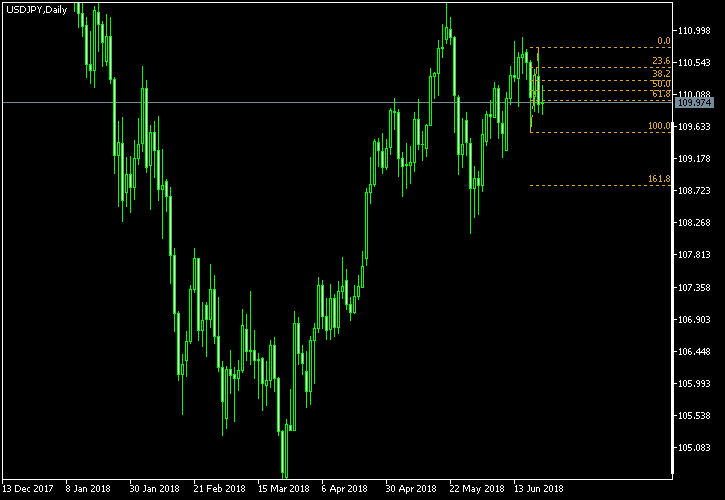
USD/JPY
Floor pivot points
| 3rd Sup |
2nd Sup |
1st Sup |
Pivot |
1st Res |
2nd Res |
3rd Res |
|
| 108.22 |
108.89 |
109.43 |
110.09 |
110.64 |
111.30 |
111.84 |
Woodie’s pivot points
| 2nd Sup |
1st Sup |
Pivot |
1st Res |
2nd Res |
| 108.86 |
109.37 |
110.06 |
110.58 |
111.27 |
Camarilla pivot points
| 4th Sup |
3rd Sup |
2nd Sup |
1st Sup |
1st Res |
2nd Res |
3rd Res |
4th Res |
| 109.31 |
109.64 |
109.75 |
109.86 |
110.08 |
110.20 |
110.31 |
110.64 |
Tom Demark’s pivot points
| Support |
Resistance |
| 109.16 |
110.37 |
Fibonacci retracement levels
| 0.0% |
23.6% |
38.2% |
50.0% |
61.8% |
100.0% |
| 109.55 |
109.83 |
110.01 |
110.15 |
110.29 |
110.76 |
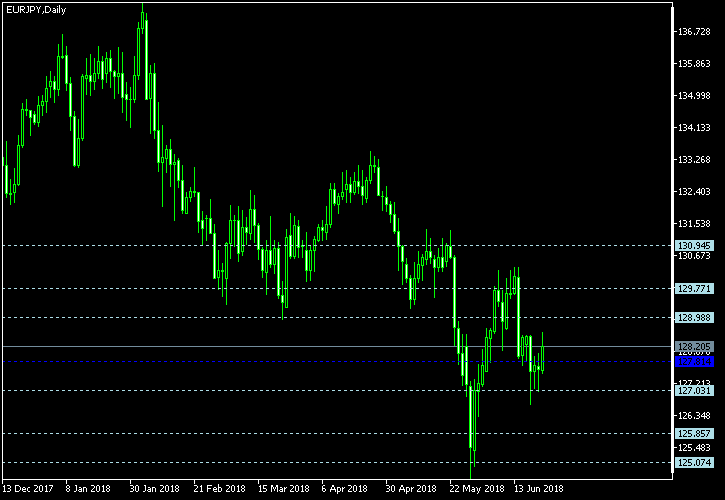
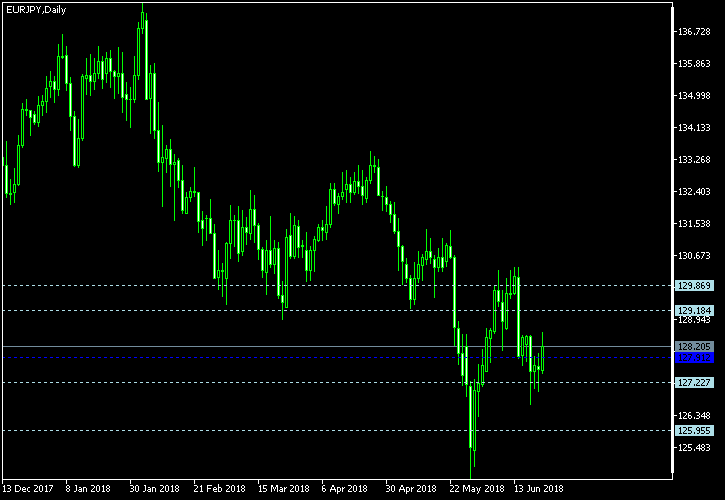
EUR/JPY
Floor pivot points
| 3rd Sup |
2nd Sup |
1st Sup |
Pivot |
1st Res |
2nd Res |
3rd Res |
|
| 125.07 |
125.86 |
127.03 |
127.81 |
128.99 |
129.77 |
130.95 |
Woodie’s pivot points
| 2nd Sup |
1st Sup |
Pivot |
1st Res |
2nd Res |
| 125.95 |
127.23 |
127.91 |
129.18 |
129.87 |
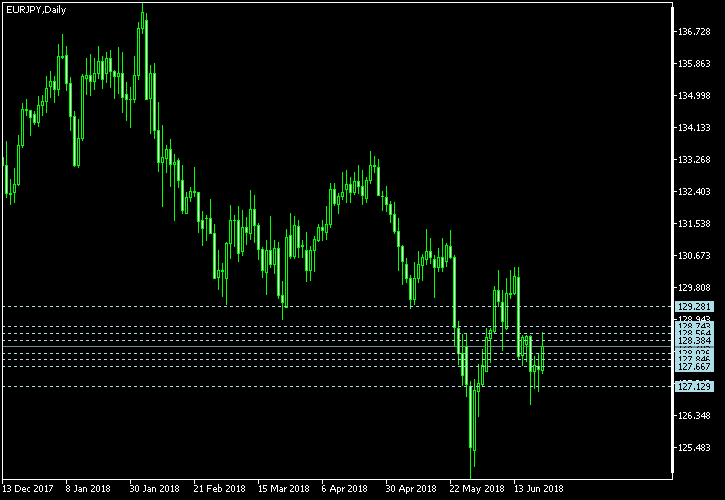
Camarilla pivot points
| 4th Sup |
3rd Sup |
2nd Sup |
1st Sup |
1st Res |
2nd Res |
3rd Res |
4th Res |
| 127.13 |
127.67 |
127.85 |
128.03 |
128.38 |
128.56 |
128.74 |
129.28 |
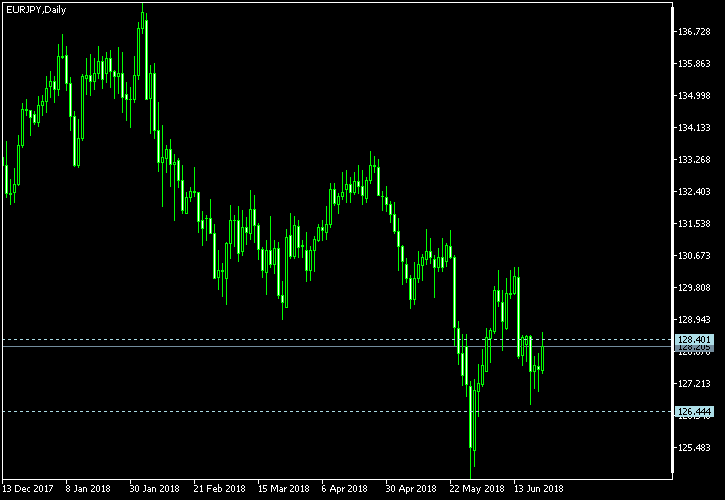
Tom Demark’s pivot points
| Support |
Resistance |
| 126.44 |
128.40 |
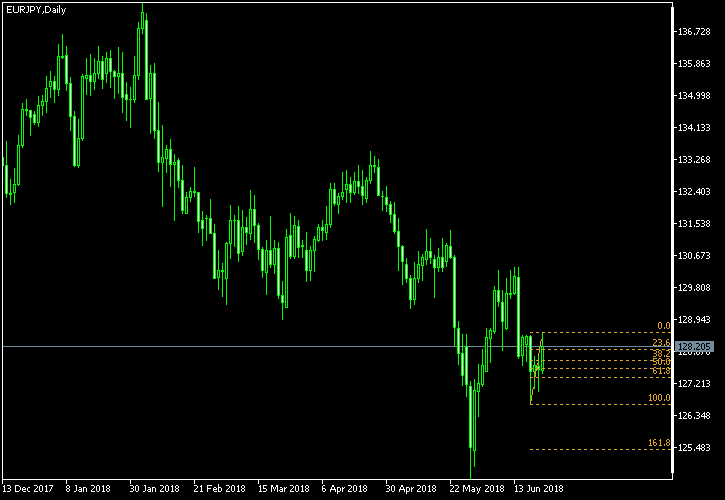
Fibonacci retracement levels
| 0.0% |
23.6% |
38.2% |
50.0% |
61.8% |
100.0% |
| 126.64 |
127.10 |
127.39 |
127.62 |
127.85 |
128.60 |
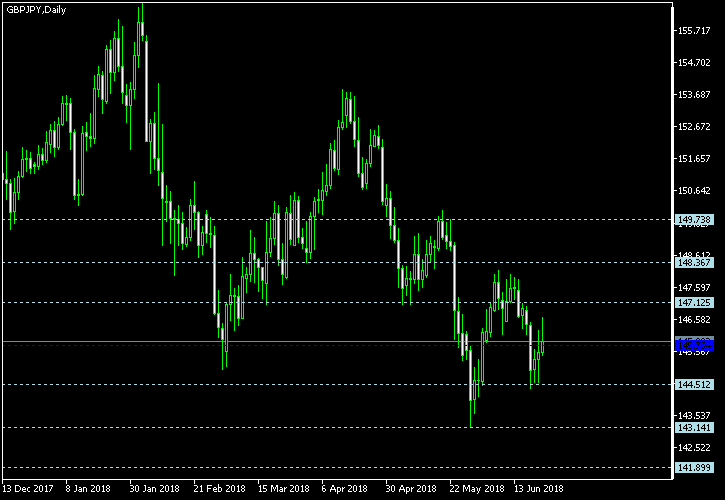
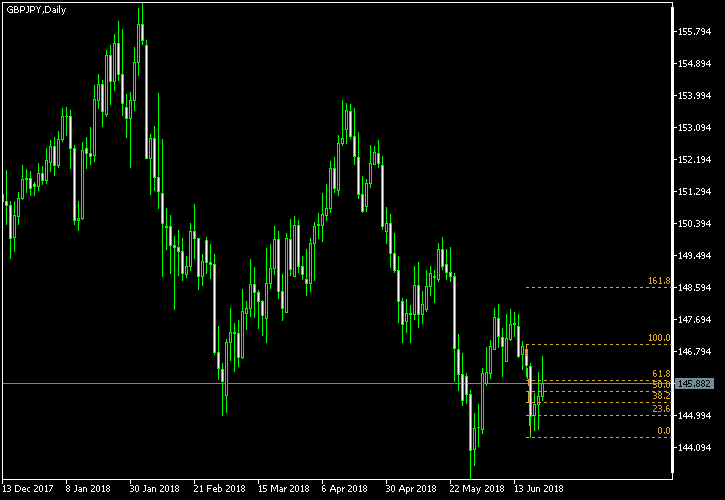
GBP/JPY
Floor pivot points
| 3rd Sup |
2nd Sup |
1st Sup |
Pivot |
1st Res |
2nd Res |
3rd Res |
|
| 141.90 |
143.14 |
144.51 |
145.75 |
147.12 |
148.37 |
149.74 |
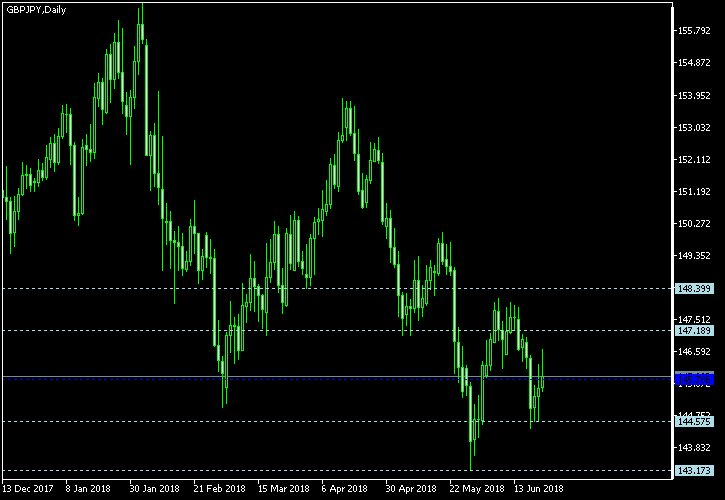
Woodie’s pivot points
| 2nd Sup |
1st Sup |
Pivot |
1st Res |
2nd Res |
| 143.17 |
144.58 |
145.79 |
147.19 |
148.40 |
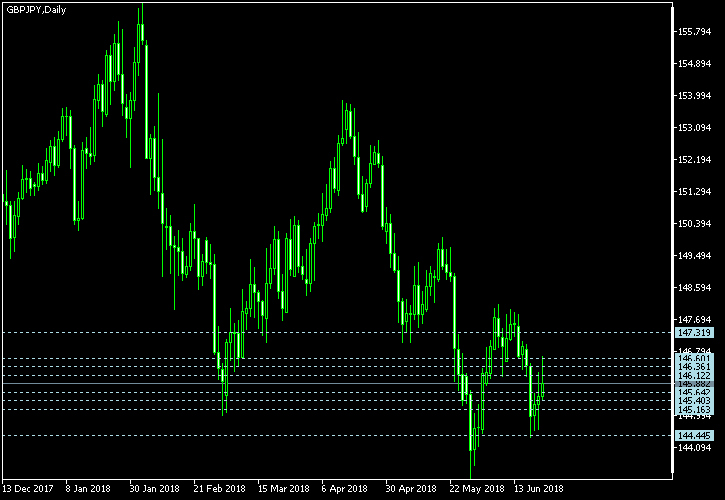
Camarilla pivot points
| 4th Sup |
3rd Sup |
2nd Sup |
1st Sup |
1st Res |
2nd Res |
3rd Res |
4th Res |
| 144.44 |
145.16 |
145.40 |
145.64 |
146.12 |
146.36 |
146.60 |
147.32 |
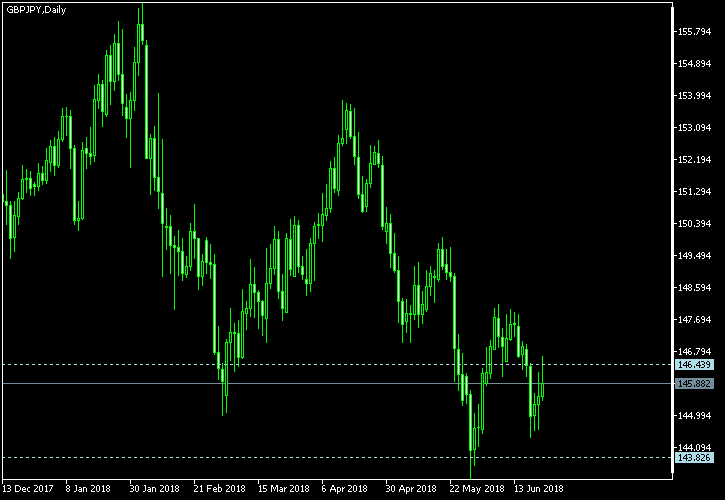
Tom Demark’s pivot points
| Support |
Resistance |
| 143.83 |
146.44 |
Fibonacci retracement levels
| 0.0% |
23.6% |
38.2% |
50.0% |
61.8% |
100.0% |
| 144.38 |
145.00 |
145.38 |
145.69 |
146.00 |
147.00 |
If you have any questions or comments on this technical analysis, please feel free to reply below.