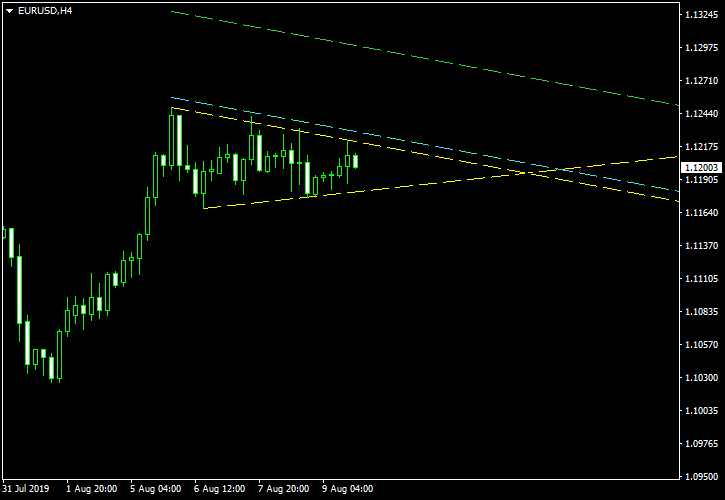
EUR/USD is trading in a clear downtrend if we look at the long-term charts of this currency pair. However, its 4-hour chart shows another picture — a recovery rally topped with a symmetrical triangle, which is a likely continuation pattern.
The borders of the triangle are the yellow lines. The cyan line is the potential entry level, which is placed at 10% of the triangle’s base width above the upper border. The green line is my potential take-profit level in case of the breakout; it is placed at 100% of the triangle’s base width above the upper border. I will set my stop-loss to the lowest point of the triangle, which is at 1.1167. I will ignore bearish breakouts from this pattern. You can click on the image to see a full-size chart:

I have built this chart using the ChannelPattern script. You can download my MetaTrader 4 chart template for this EUR/USD pattern. You can trade it using my free Chart Pattern Helper EA.
If you have any questions or comments regarding this symmetrical triangle on the EUR/USD chart, please feel free to submit them via the form below.