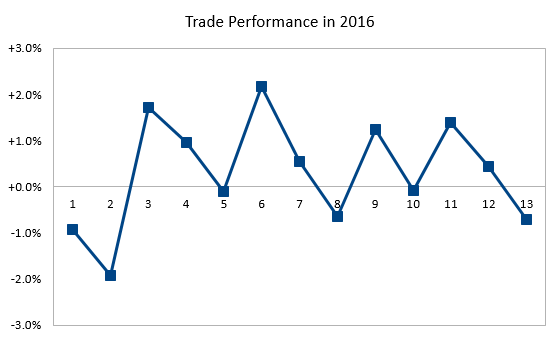
I still have one 2016 trade active (NZD/USD short from ascending channel), and there is a pending order carried over from 2016 (USD/CAD ascending channel). Nevertheless, it is now time to calculate my profit for the past year. The remaining position and order will count for 2017 results.
Contents
- 1 Profitable trades
- 2 Worst losers
- 3 Other trades
- 4 Poll
Unfortunately my minuscule 2015 profitability has turned into a loss in 2016. Although a 0.7% loss is not a big deal, it is still a loss. In 2016, I have made 13 trades vs. 17 trades in 2015.

Profitable trades
Three out of four of my profitable trades were double tops — one in GBP/CAD, and two in AUD/NZD. This means that all of my 2016 double top trades turned profitable. The remaining profitable trade was a descending channel in USD/CAD and it was also my best trade last year.
Worst losers
My worst trades have one word in common — ‘triangle’. The worst one was the symmetrical triangle in EUR/NZD on the weekly chart. Then comes the symmetrical triangle in CAD/JPY on the daily timeframe. And the third worst trade was the ascending triangle in EUR/AUD on the 4-hour chart.
Other trades
The 13 trades I take into account when calculating 2016 profitability are based on my main strategy. It is focused on chart patterns and dictates clear rules for entries and exits. But there were two trades in 2016 that I do not include into my performance results:
I would not call 2016 a lucky year for my Forex trading. I am looking to register a much better performance in 2017. And how about you?
Poll
![]() Loading …
Loading …
If you want to share some more information about your Forex trading performance in 2016, please feel free to do so using the commentary form below.