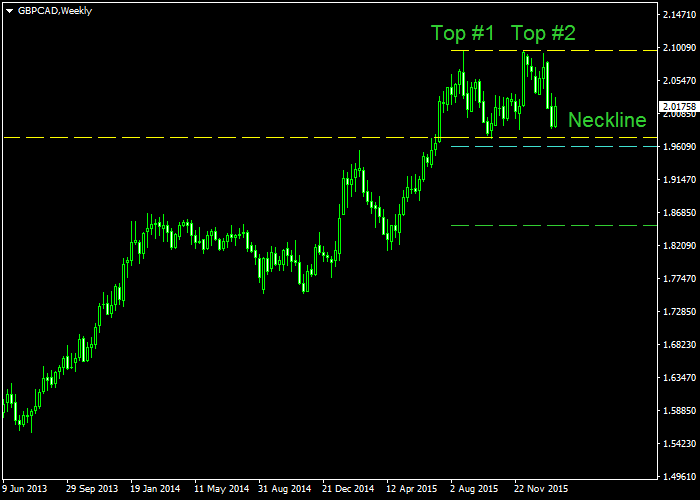
Not all chart patterns are created to look like an ideal example — some of them look horribly despite meeting the formal requirements of their kind. The latest development on GBP/CAD weekly chart is just such a case. The pattern began forming back in July 2015. The first top was reached in the end of August, then the middle bottom was set in October. The second part peaked in December 2015 but has also shown another similarly sized spike in January of 2016. The pattern is a consolidation of a
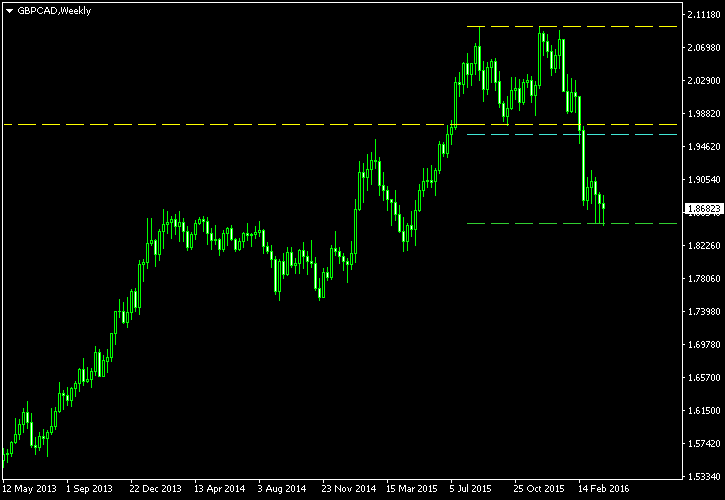
The yellow lines depict the borders of the pattern. The upper one is drawn on the tops; the lower one serves as the pattern’s neckline. The cyan line is my sell trade trigger. It is positioned at 10% of the pattern’s height below the lower border. At 100% of the height, you can see my potential profit target — the green line. I will set my

I have built this chart using the ChannelPattern script. You can download my MetaTrader 4 chart template for this GBP/CAD pattern. You can trade it using my free Chart Pattern Helper EA.
Update 2016-02-18: The short trade entered yesterday on a strong breakout down. Entry level is at 1.96127,

Update 2016-03-31:

If you have any questions or comments regarding this double top on GBP/CAD chart, please feel free to submit them via the form below.