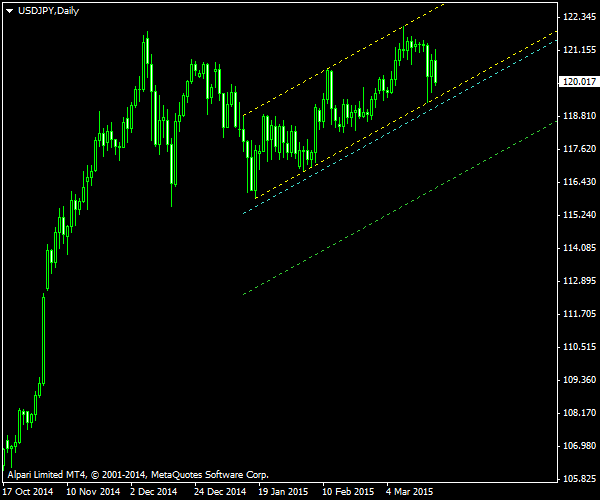
The US dollar demonstrated an impressive rally against the Japanese yen since August of 2014. The rally has stalled in December and the price has entered a sort of consolidation in a deformed triangle pattern followed by an ascending channel. The latter is currently presenting a valid trading opportunity for those who wish to bet against USD/JPY further gains. The validity of the pattern is additionally confirmed by the signs of a forming double top.
The chart below depicts the pattern in details. The yellow lines show the channel itself. The cyan line is the breakout entry level with some buffer zone. The green line is the target.

The channel was detected using the Channel Pattern Detector indicator. The chart was built using the ChannelPattern script. You can download my MetaTrader 4 chart template for this USD/JPY pattern. It can be traded using my free Chart Pattern Helper EA.
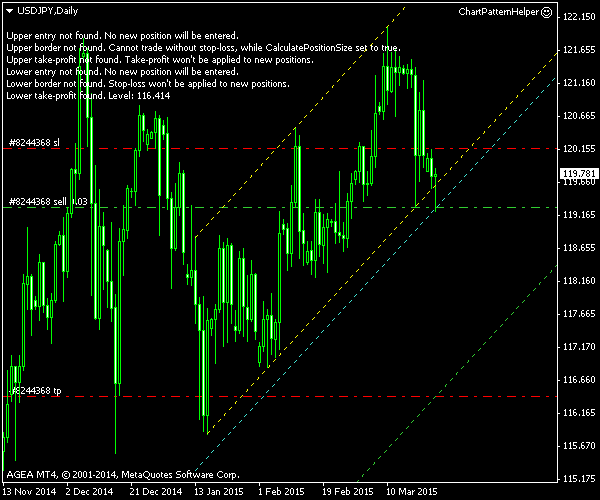
Update 2015-03-24 17:26 GMT: The bearish breakout has already occurred. Short position entered at 119.28 about 3 hours ago.

Update 2015-03-30 9:18 GMT: My broker (AGEA) had some glitches in the quote feed during the late night trading and decided to close my position at its
Update 2015-03-31: The broker has restored my trade, but unfortunately, it has run into

If you have any questions or comments regarding this ascending channel on USD/JPY chart, please feel free to submit them via the form below.