
The two recent EUR/USD H4 descending channel patterns were rather successful for me. The USD/JPY D1 horizontal channel pattern is still in an active trade phase. Today, it’s time to look at the new channel pattern — the descending one on the USD/CAD H4 chart. It has enough lower and upper border touches and is also long enough (3 weeks) to be considered a probable pattern for trading.
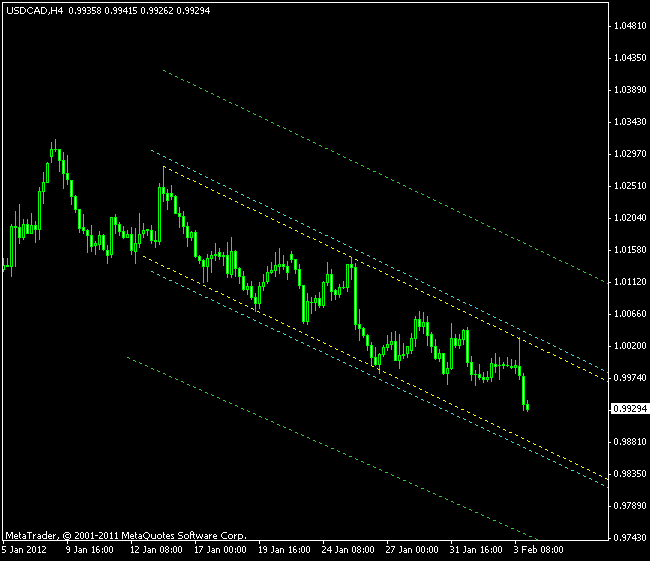
The channel is 144 pips high. I will use pending stop orders located at channel borders +/-10% of the channel height to enter a breakout position with this pattern. As always I will set my targets to borders +/-100% of the channel height.
As you see on the image below, the channel lines are drawn in yellow color. Cyan lines mark the breakout entry levels. Green lines demonstrate possible target levels:
If you have any questions or comments regarding this USD/CAD chart pattern, please feel free to reply via the form below.