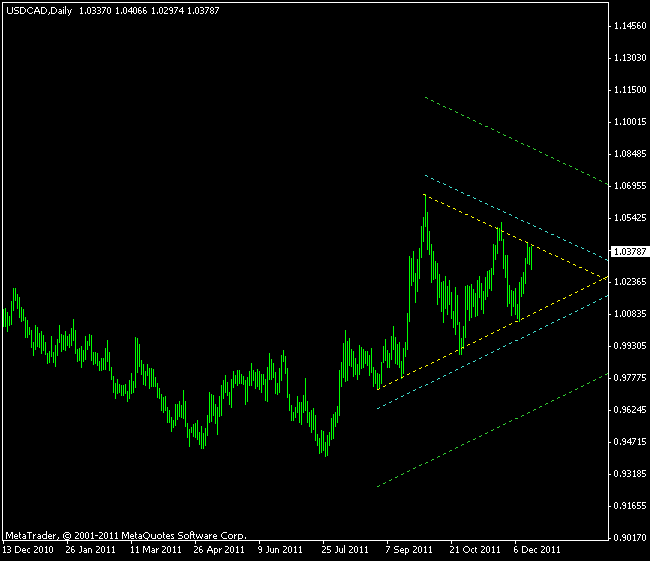
Symmetrical triangles is often a reliable continuation pattern, but this time it continues a rather
The height of the whole pattern is 931 pips here. But, unlike the previous chart patterns, the symmetrical triangles use only half of the height as a profit target level — 465.7 in this case. The breakout points are set to the border +/- 10% of height (or 93.1 pips). As with all the breakout patterns, it’s recommended to set the
The reference chart of this symmetrical triangles pattern can be seen below. You can see the pattern itself outlined with the yellow lines, the breakout lines shown with the cyan color, and the

If you have any questions or comments regarding this EUR/CHF chart pattern, please feel free to reply via the form below.