Fundamental Forecast for USOIL: Short-term Negative
WTI Crude Oil Fundamental Talking Points:
- The ONE Thing: The rebound in crude appears hollow as OPEC is expected to add to the global oil supply. The increase in supplies, which could come online quickly are already pressuring prices and adding to the coming supply, US oil inventories jumped by the most in a decade on higher US output.
- Per BHI, U.S. Oil Rig Count rises by 1 to 862, US total count at 1,062
- OPEC oil output remains in hot contention as Venezuela pleads for OPEC to fight sanctions as their rig count falls on unpaid drillers pulling projects
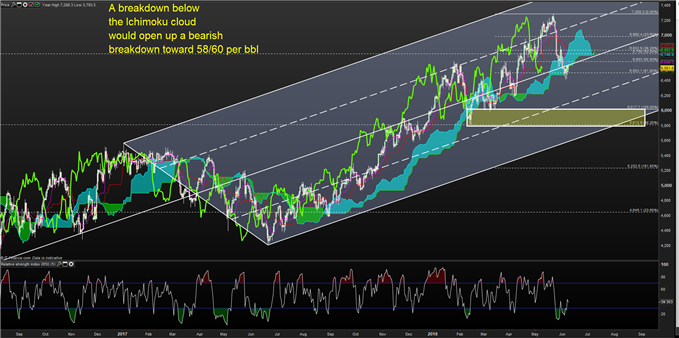
- The technical analysis picture of crude oil has a focus on the 61.8% at $65.60 that also aligns with the Ichimoku cloud. A breakdown from here, which the fundamentals are beginning to favor could see a broad breakdown toward $60/58 per bbl.
Crude oil may have a difficult time resuming the trend that was so prevalent in the first half of the year as OPEC plans to fight sanctions and increase productions while US oil inventories showed the sharpest increase in US oil stockpiles since October 2008.
The combination may make the recent bounce in price in WTI near $66 short-lived and hollow as bearish pressure is seen through the oil curve, which is flattening.
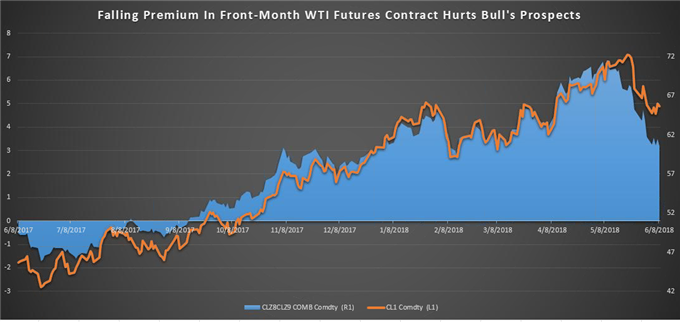
December ’18 – December ’19 Spread Breaks Down on Increasing Global Production

Data source: Bloomberg
An oil curve is often a guiding light for traders who like to combine technical analysis with moves in the correlated spot markets. The curve answers the simple questions: is there a premium or discount of this homogeneous product when comparing a near-dated futures contract to a later dated contract?
A premium of the near-month contract aligns with buying pressure or the desire to buy now because supplies are likely low relative to perceived demand. As the near-month contract converges or drops below the later-dated contract, we typically see a drop in price like you see above.
Either way, the falling blue line, which is the spread between December 2018-December 2019 NYMEX WTI contract helps to show that the premium in the front-month contract is waning and with it, so is the price of spot WTI.
Venezuela’s Plea
Oil traders are getting conflicting information about supply from OPEC as Saudi Arabia and Russia are expected to wind down their production curbs, which has helped to flatten the spread above. Additionally, the crippling Venezuelan exports have been a two-headed monster of poor economic health reducing the production of oil as well as US sanctions.
Specifically, Venezuelan Oil Minister Manuel Quevedo has requested that at the June 22 meeting that the de-facto head of OPEC, Saudi Arabia, and key ally, Russia condemn the ‘unilateral sanctions’ of the US that are said to have brought about financial and economic aggression for the national oil industry of Venezuela.
Venezuela’s plea aligns with Iran’s, who is OPEC’s number 3 producer that recently received sanctions by the US.
Once again, WTI and Brent crude has become the market everyone is discussing! Unlock our forecast here
Crude Oil Sits On Broad Support With Weakening Fundamentals

Chart Source: Pro Real Time with IG UK Price Feed. Created by Tyler Yell, CMT
The sharp pull-back is seen well with RSI(5) on the Daily chart. RSI(5) has hit the lowest point since crude began its impressive in June. Crude’s spot price has stayed above the Ichimoku cloud on a daily basis, but counter-trend moves tend to happen in three-waves, and it appears premature to call the counter-trend move lower over. A breakdown below last week’s low at $64.18 would argue that we could see a move toward $60/58 per barrel.
Technical resistance, which is important given the recent reversal is coming off of 3-year highs would be at $68.61/bbl, which is the May 30 high.
Not familiar with Ichimoku? You’re not alone, and you’re in luck. I created a free guide for you here
Next Week’s Data Points That May Affect Energy Markets:
The fundamental focal points for the energy market next week:
- Tuesday: President Donald Trump and North Korean leader Kim Jong Un meet in Singapore
- Tuesday: OPEC and the IEA release supply/demand forecasts and production data in monthly reports
- Tuesday 4:30 PM ET: API Weekly Oil Inventories Report
- Wednesday 10:30 AM ET: EIA issues weekly US Oil Inventory Report
- Wednesday 2:00 PM ET: FOMC Interest Rate Decision, Fed rate hike 100% priced into the market
- Wednesday 10:00 PM ET: China’s National Bureau of Statistics releases industrial output for May (includes oil refining)
- Friday: Energy ministers from G-20 nations, including Russia, Mexico, U.S. and Saudi Arabia, hold their annual meeting in Bariloche, Argentina
- Friday 1:00 PM ET: Baker-Hughes Rig Count
- Friday 3:30 PM ET: Release of the CFTC weekly commitments of traders report on U.S. futures, options contracts
—Written by Tyler Yell, CMT
Tyler Yell is a Chartered Market Technician. Tyler provides Technical analysis that is powered by fundamental factors on key markets as well as trading educational resources. Read more of Tyler’s Technical reports via his bio page.
Communicate with Tyler and have your shout below by posting in the comments area. Feel free to include your market views as well.
Discuss this market with Tyler in the live webinar, FX Closing Bell, Weekdays Monday-Thursday at 3 pm ET.
Talk markets on twitter @ForexYell