CAD Analysis and Talking Points
- Hawkish Fed Could See USDCAD at 2018 Highs
- Widening US-Canadian Bond Spreads Calls for Softer CAD
See our Q2 CAD forecast to learn what will drive the currency through the quarter.
Is 4 the Magic Number?
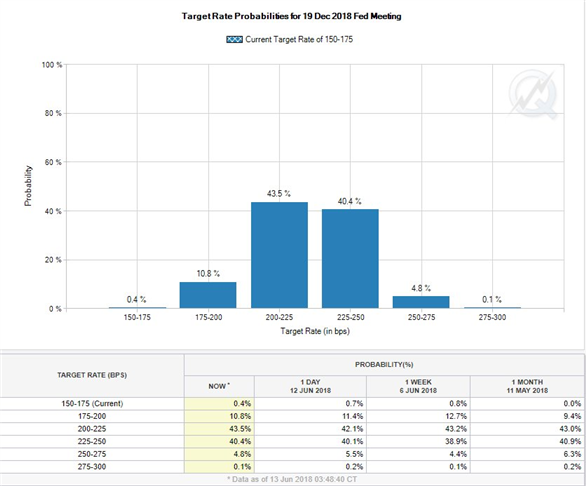
Today will see the release of the FOMC meeting where it is near enough fully priced in that the central bank will hike the Federal Fund Rate by 25bps to 1.75-2%. However, the focus among investors is the accompanying statement and more specifically the Fed Reserve Dot Plot projection. As it stands, the median view among the FOMC is for 3 2018 rates at 2.125%, a shift by one more member for 4 rate hikes would see the median projection at 2.375%. As such, this will likely push the USD higher amid a repricing for 4 2018 rate hikes, which currently stands at 45% according to money markets.

Source: CME
Widening US-Canadian Bond Spreads to Pressure CAD
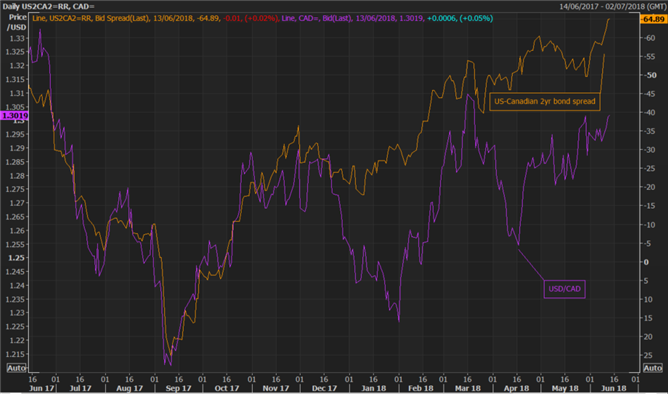
A hawkish Fed in which the dot plot is moved to 4 2018 rate hike will likely lead to the most volatility in short term rates, whereby US 2yr yields may continue to press higher. This in turn will likely see a continued widening between US-Canadian 2yr bond spreads, which recently surpassed -60bps to lows -65bps. Additionally, greater focus has been placed on interest rate differentials amid the uncertainty from NAFTA, alongside the trade spat between the US and Canada over steel and aluminium tariff leading to receding BoC rate hike expectations (66% priced in for July rate hike vs. Prev. 75%). Subsequently, the continued widening of US-Canadian bond spreads could see USDCAD push higher.

Source: Thomson Reuters
OPEC Set to Hike Oil Production
Commodities currencies have remained subdued in the lead up to the bi-annual OPEC meeting on June 22nd, where there are growing expectations that the cartel will ease current supply curbs. In turn, this has put a lid on further gains in oil prices, consequently keeping the pressure on CAD. Given the continued boost of US oil production, an easing of OPEC and Non-OPEC supply curbs would likely see risks to oil prices tilted to the downside.
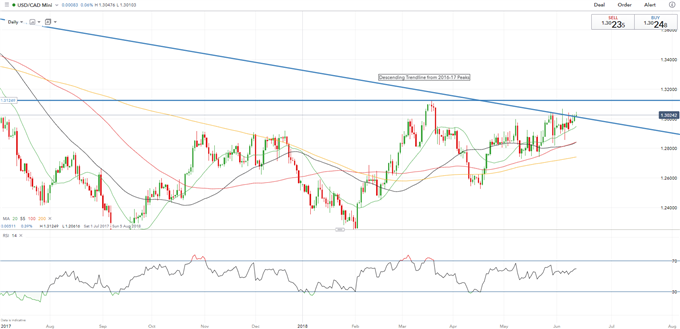
USDCAD PRICE CHART: DAILY TIME FRAME (OCTOBER 2016- MAY 2018)

USDCAD has made a break above the descending trendline from the 2016-17 peaks. However, a firm break above 1.3067 (June 5th high) is needed to confirm a retest of the 2018 highs at 1.3124.
Given that markets are pricing in for a hawkish FOMC the scope for disappointment increases, resulting in greater risk reward to the downside. Support in USDCAD remains at 1.2920, while the 20DMA sits at 1.2950.
IG Client Positioning Sentiment notes that the combination of current sentiment and recent changes provides a mixed USDCAD trading bias. For full client positioning click here
— Written by Justin McQueen, Market Analyst
To contact Justin, email him at Justin.mcqueen@ig.com
Follow Justin on Twitter @JMcQueenFX