USD Analysis and Talking Points
- Signs are arising for the US Dollar to top out
- Aside from Trade Wars focus is on FOMC and NFP
See our Q3 FX forecast to learn what will drive major currencies throughoutthe quarter.
Given the holiday thinned trade with US participants away for Independence Day, the USD index has seen very little price action, trading with marginal gains. Focus will be on tomorrow’s FOMC meeting minutes scheduled for 1800GMT and Friday’s NFP report. As a reminder, DailyFX analyst’s Christopher Vecchio and Michael Boutros will be conducting a live webinar, click here.
Trade Wars Loom Ahead of Tariff Implementation
Alongside this, investors remain wary over the current trade war environment with the US set to impose $34bln worth of tariffs on Chinese goods from Friday, while reports from China have also suggested that reciprocal tariffs will also be placed on Friday. As such, this could see the recent USD ascension become somewhat exhausted, as evidenced by the failure to hold above 95.00, having rejected 95.35-50. The escalation in trade war tensions could in turn favour USDJPY selling with sentiment likely to be dampened, coupled with falling bond yields.
PBoC Intervention Suggests Only Modest USD Gain Potential
Recent PBoC verbal intervention and actual intervention by state-owned Chinese banks in regard to the Chinese Yuan decline has also indicated that gains in the USD may only be modest. Intervention in the Yuan has provided support for the currency at the expense of the USD with Chinese officials implying that a rate of 6.7-6.8 could prompt the PBoC to intervene.
Background on Trade Wars
- Impact of Trade Wars click here
Speculative Positioning Indicate Modest USD Upside
Recent changes in speculative positioning have shown USD longs at the highest since May 2017, in turn, this suggests that only modest upside in the USD can be seen from current levels. Additionally, with the rising trade war uncertainty, USDJPY long positions which amount to $3.88bln could face risks of a short squeeze.
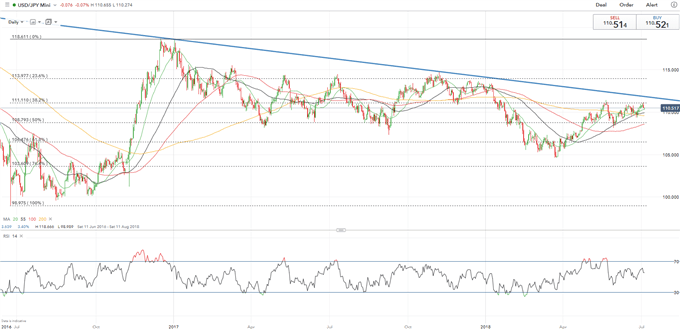
USDJPY PRICE CHART: DAILY TIME FRAME (June 2016- July 2018)

USDJPY has continued to reject 111.11 which marks the 38.2% Fibonacci level of the 98.97-118.61 rise, while just above, the falling trendline from the January 2017 high suggests upside is limited. Focus will be on the 50% Fibonacci retracement sitting at 108.79.
— Written by Justin McQueen, Market Analyst
To contact Justin, email him at Justin.mcqueen@ig.com
Follow Justin on Twitter @JMcQueenFX