Gold price, news and analysis:
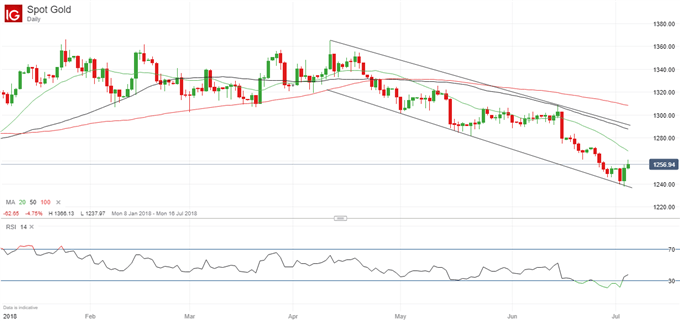
– The gold price has traded within a downward sloping channel since mid-April.
– Having bounced from support at the lower boundary, it could be heading towards resistance at the upper boundary.
Our trading forecasts for Q3 have just been published; you can find the gold guide here.
And check out the IG Client Sentiment data to help you trade profitably.
Gold price rally in focus
The price of gold has singularly failed to benefit from the recent “risk off” tone in the markets. Despite its traditional role as a “safe haven” it has been falling steadily since mid-April even though fears of a trade war between the US and other nations have led to a broad flight to quality.
Now, though, that could be about to change. Over the last few trading sessions it has repeatedly failed to fall below trendline support and that means a climb towards trendline resistance at the upper boundary of the downward-sloping channel in place for almost three months is possible.
Gold Price Chart, Daily Timeframe (Year to Date)

Currently, the trendline support lies just under $1,240 per ounce. With the price currently not far from $1,257, a bounce could mean a climb as high as $1,290. Meanwhile, to the downside there is further support at the $1,236.58 December 12 low, and at the $1,234.23 200-week moving average.
Resources to help you trade the forex markets
Whether you are a new or an experienced trader, at DailyFX we have many resources to help you: analytical and educational webinars hosted several times per day, trading guides to help you improve your trading performance, and one specifically for those who are new to forex. You can learn how to trade like an expert by reading our guide to the Traits of Successful Traders.
— Written by Martin Essex, Analyst and Editor
Feel free to contact me via the comments section below, via email at martin.essex@ig.com or on Twitter @MartinSEssex