The Australian dollar versus the US dollar currency pair seems to be caught between two dimensions — or at least levels — and thus triggers the question: where will the next move bring the price to?
Long-term perspective
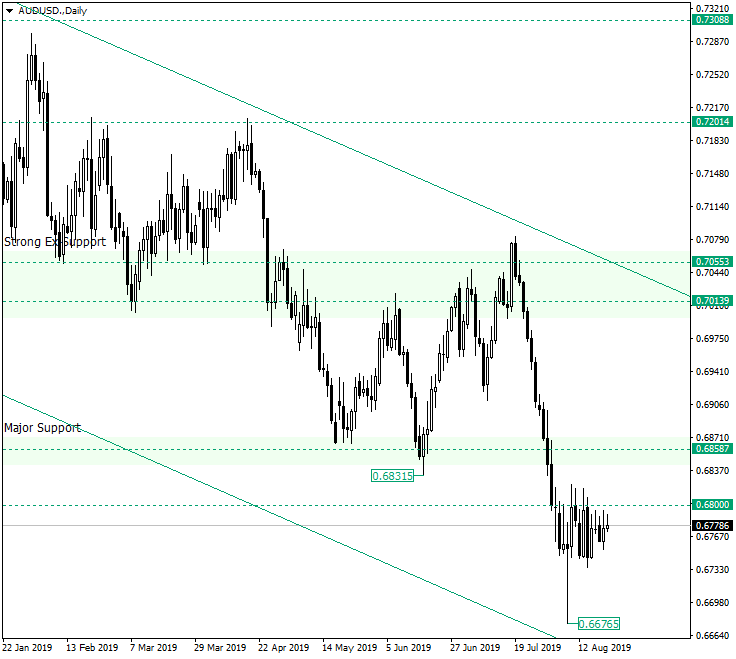
After confirming the important resistance area crafted by the upper line of the descending channel and the zone defined by the 0.7055 and 0.7013 levels, the price started a movement towards the south, one which is nothing more than an impulsive wave that played its role and — as expected — extended until the lower line of the descending channel, piercing the major support of 0.6858 and the 0.6800 psychological level along the way.
Of course, after such a strong decline, the price has to catch its breath. It does so by forming either a correction that retraces a certain percentage from the decline or by printing a symmetrical continuation pattern — such as a rectangle, pennant or flag — which represents a consolidation phase. The fact that the price etched a pin-bar on August 7, made the traders believe that what will follow is an actual correction, but it looks like as if a consolidation phase took shape instead. So, this hybrid structure — that began like a correction but continued as a consolidation phase — obfuscates any clear perspectives.
However, the simple fact that the price did not react to the pin-bar makes it clear that the situation should be considered as being a consolidation phase, limited by the 0.6800 resistance. So, as long as this level holds or it is falsely pieced — maybe while allowing the confirmation as resistance of the previous lower low at 0.6831 — the expectancies are for further declines, a first target being represented by the 0.6700 psychological level, followed by 0.6600. Only a clear confirmation of 0.6858 as support will cancel this scenario.
Short-term perspective
It can be said that the price tries to consolidate an upwards channel, but the resistance trendline that limits the highs of the correction seems to do a pretty good job at keeping the bulls in check. The only thing that does not align with this message is the fact that the price sits on the 23.6 level of the Fibonacci retracement.
So, once the lower line of the ascending channel and the 23.6 level are pierced and confirmed as resistance, the continuation of the decline will be one step closer to materializing. In such a scenario, the targets are the 11.4 and 0.0 Fibonacci levels.
If the price manages to start an impulsive wave within the ascending channel, then caution would be advised and the first to be targeted is the 38.2 level.
Levels to keep an eye on:
D1: 0.6831 0.6800 0.6700 0.6600

H4: 0.6865 ant the Fibonacci retracement levels — mainly 38.2 23.6 11.4 0.0
If you have any questions, comments, or opinions regarding the US Dollar, feel free to post them using the commentary form below.