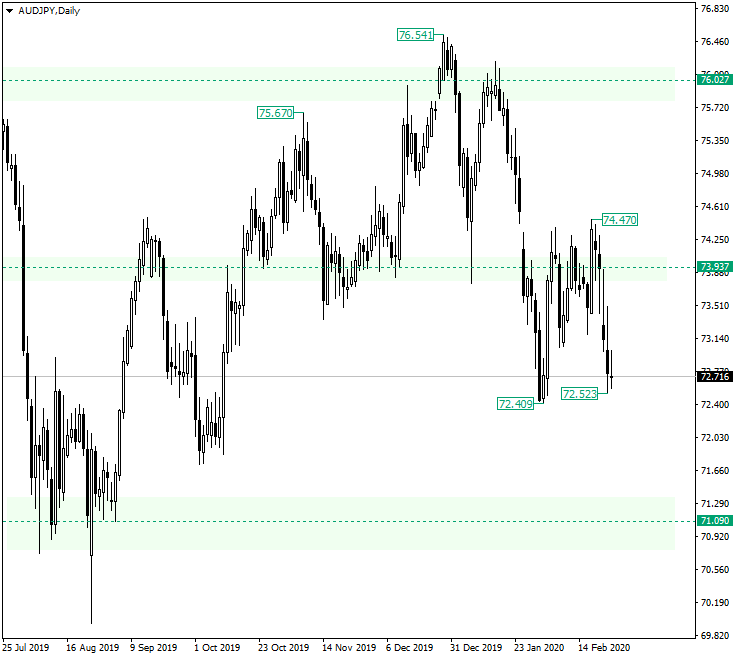
The Australian Dollar versus the Japanese yen currency pair is in a spot that may very well facilitate both a rally or a fall. But which one has more chances of becoming a reality?
Long-term perspective
The ascending trend that started after the confirmation of 71.09 as support peaked at 76.54 and looks as if it ended after the price slipped under an important support that later became resistance, 73.93, respectively.
What is interesting to note is that, after printing the low of 72.40, the price began forming a throwback with the purpose of confirming the pierced support — 73.93 — as resistance.
But even if the level was confirmed as resistance and, as a result, the price began dropping, the bulls tried their best to limit any further depreciation.
However, after the third confirmation — that was actually a false break of the 73.93 resistance, peaking at 74.47 — the price extended towards the south, etching the low at 72.52.
Even if in relation with the previous low — the one at 72.40 — the last one — 72.52 — can be considered a higher low, which in turn may attract the bulls, the fact that the price is still falling does not enforce the idea that the las low is at 72.52, as the price could further see losses and thus crystalize a lower low concerning 72.40.
So, as long as the price keeps its distance from 73.93, further depreciation is to be expected, targeting 71.00. Only a strong bullish formation in the area corresponding to the 72.40 low may trigger a sustained appreciation, one that could reach 73.93 once more.
Short-term perspective
The fall from 75.33 extended to as low as 72.47. After confirming 72.47 as support, the price appreciated and started a consolidation phase that took the shape of a range that was centered by the levels of 73.90 and 73.39, respectively.
As 73.90, even if it was confirmed as support, could not spell appreciations able to conquer 74.56 (as they stopped somewhere between the middle of the way from 73.90 to 74.56), the bullish attempts to drive the prices higher ended up as failures.
On the other hand, as the 73.39 support gave way and was confirmed as resistance, allowing a depreciation that reached the support of 72.47, it can be considered that the bears are the ones in charge, at least for the time being.
So, if 72.47 is pierced (and confirmed as resistance), then the target is represented by the psychological level of 72.00 — not highlighted on the chart. But if 72.47 ends up as being falsely pierced, then 73.39 could be paid a visit.
Levels to keep an eye on:
D1: 71.00 73.93

H4: 72.47 73.39
If you have any questions, comments, or opinions regarding the Technical Analysis, feel free to post them using the commentary form below.