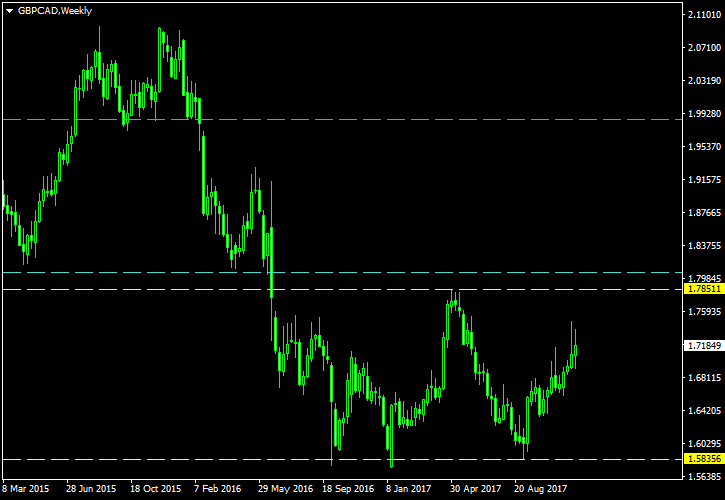
Following a failed descending triangle formation, the pound is now clearly trying to reverse its
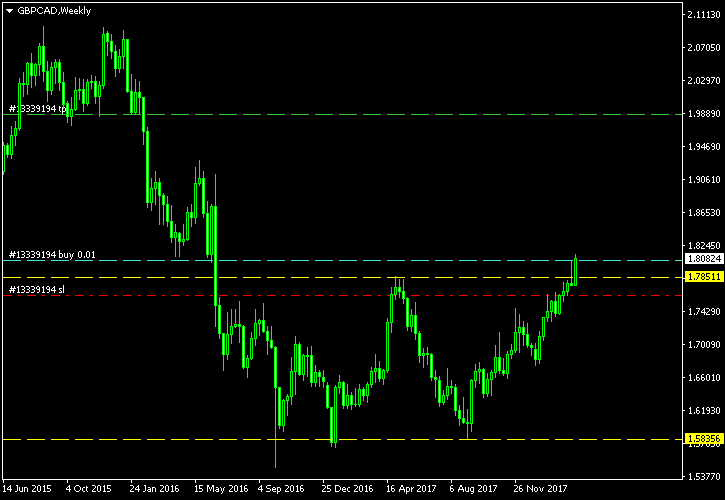
You can see the bottoms and the neckline marked by the yellow lines on the chart below. The cyan line is my entry level positioned at 10% of the pattern’s height above the neckline. The green line represents my potential

I have built this chart using the ChannelPattern script. You can download my MetaTrader 4 chart template for this GBP/CAD pattern. You can trade it using my free Chart Pattern Helper EA.
Update 2018-03-14: Finally, my pending buy has been triggered yesterday at 15:24 GMT. The entry level is 1.80527 with

If you have any questions or comments regarding this double bottom on the GBP/CAD chart, please feel free to submit them via the form below.