
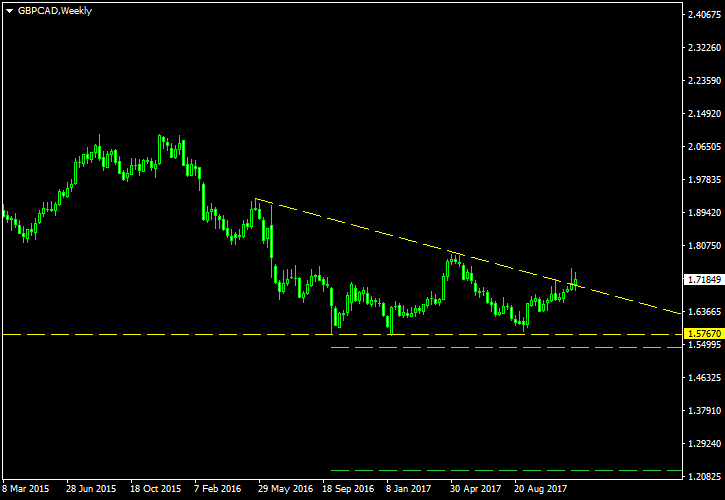
The rate consolidation that took form a descending triangle on the weekly chart of GBP/CAD reflects the broad weakness of the Great Britain pound, which is also seen in the EUR/GBP ascending triangle posted here yesterday. The downtrend in GBP/CAD lasts since 2015 and is forming a strong horizontal support since October last year. Traders taking this setup should be wary of its correlation with the one in EUR/GBP.
The chart pattern is shown with the yellow lines on the image below. The cyan line shows my breakout entry level located at 10% of the triangle’s base width below the lower border. The green line shows my

I have built this chart using the ChannelPattern script. You can download my MetaTrader 4 chart template for this GBP/CAD pattern. You can trade it using my free Chart Pattern Helper EA.
Update 2017-12-09: I am cancelling this trade setup because the triangle had been breached in the wrong direction:
If you have any questions or comments regarding this descending triangle on the GBP/CAD chart, please feel free to submit them via the form below.