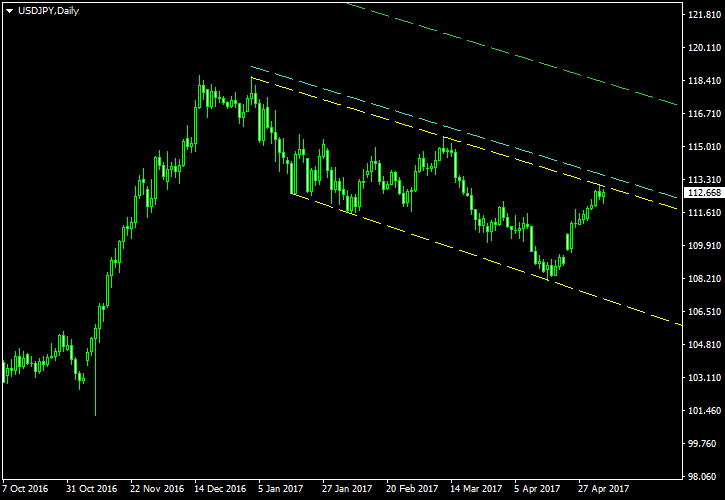
The daily chart of the USD/JPY currency pair demonstrates a classic occurrence of the descending channel pattern ready for an upward breakout. The channel has formed after the pair had peaked in December of 2016. It lasted long enough and produced a sufficient number of border touches to be viewed as a valid trend continuation formation.
The channel is marked with the yellow lines on the chart screenshot below. The cyan line marks my breakout entry point — it is positioned at 10% of the channel’s width above the upper border. The green line marks my descending

I detected this channel using the Channel Pattern Detector indicator and built this chart using the ChannelPattern script. You can download my MetaTrader 4 chart template for this USD/JPY pattern. You can trade it using my free Chart Pattern Helper EA.
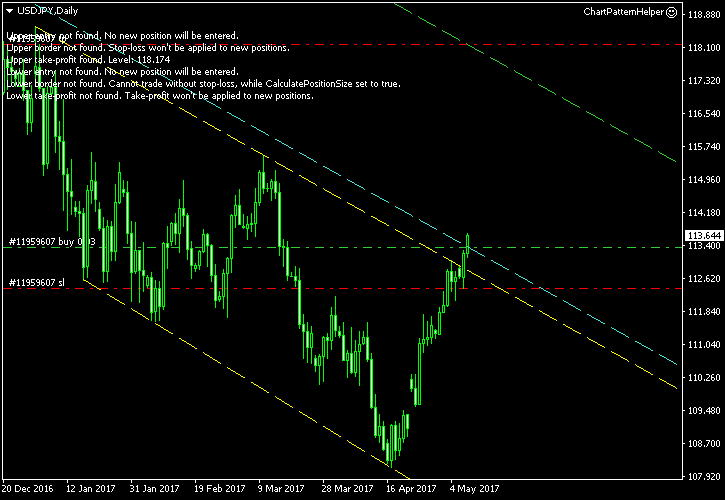
Update 2017-05-09 9:20 GMT: The pair broke through the upper trendline and triggered my entry today at 0:28 GMT. With an open price at 113.352,

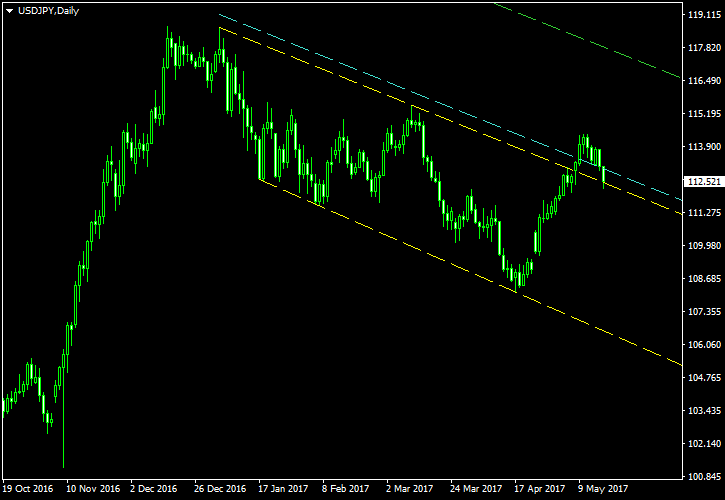
Update 2017-05-17 9:07 GMT: The trade has hit its

If you have any questions or comments regarding this descending channel on USD/JPY chart, please feel free to submit them via the form below.