Breaking News
- December 21, 2020 Do we get tax benefits on Personal Loan?
- December 18, 2020 The solicitors Preston depends on for stress-free compensation claims
- December 16, 2020 eToro: History and Key Features
- December 11, 2020 Canadian Dollar Pauses 2020 Rally Against US Peer Amid Falling Crude Prices
- December 11, 2020 Pound Crashes Against Dollar As No-Deal Brexit Appears Imminent
- December 11, 2020 USD/JPY 104.57 High Starting a New Bearish Leg?
Day: July 26, 2009
 July 26
2009
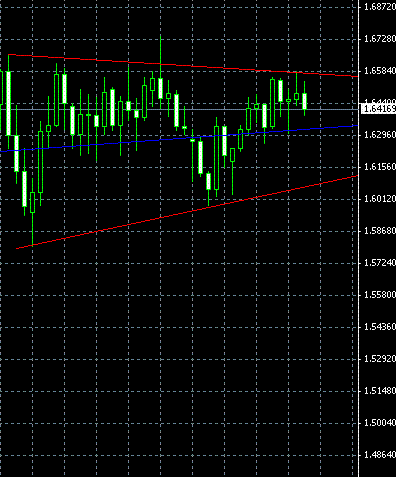
GBP/USD Chart Pattern July 26th 2009
This time I once again show only one Forex chart pattern that Ive detected during the last trading week. Its GBP/USD ascending triangle with a small downward slope. This is a bullish continuation figure and I recommend expecting an upward breakout, which can happen in a week or two. Click on the image to get the full-size chart screenshot: If you have any questions or comments regarding this GBP/USD chart pattern, please, feel free […]
Read more