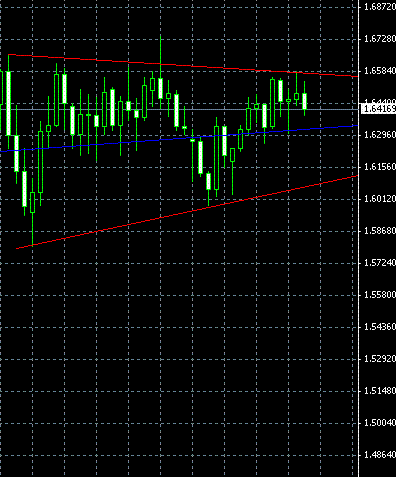
This time I once again show only one Forex chart pattern that Ive detected during the last trading week. Its GBP/USD ascending triangle with a small downward slope. This is a bullish continuation figure and I recommend expecting an upward breakout, which can happen in a week or two. Click on the image to get the full-size chart screenshot:

If you have any questions or comments regarding this GBP/USD chart pattern, please, feel free to reply below.