Breaking News
- December 21, 2020 Do we get tax benefits on Personal Loan?
- December 18, 2020 The solicitors Preston depends on for stress-free compensation claims
- December 16, 2020 eToro: History and Key Features
- December 11, 2020 Canadian Dollar Pauses 2020 Rally Against US Peer Amid Falling Crude Prices
- December 11, 2020 Pound Crashes Against Dollar As No-Deal Brexit Appears Imminent
- December 11, 2020 USD/JPY 104.57 High Starting a New Bearish Leg?
Day: August 9, 2009
 August 9
2009
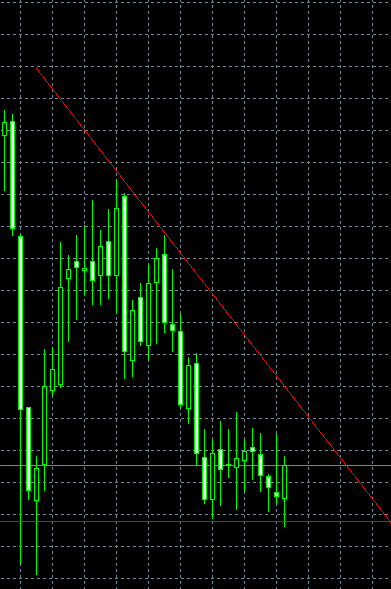
USD/CHF Chart Pattern on Weekly Timeframe
A rather awkward version of a descending triangle pattern has formed on the USD/CHF weekly chart. It begins with a huge fall in October 2008 (when the global financial crisis began) and is currently coming close to its end with the range of a price change narrowing down from above. This is probably a continuation pattern that will result in a bearish breakout. Click on the image to get a larger picture: If you have […]
Read more