
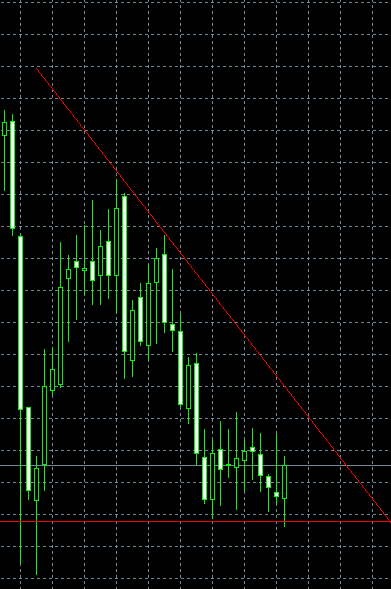
A rather awkward version of a descending triangle pattern has formed on the USD/CHF weekly chart. It begins with a huge fall in October 2008 (when the global financial crisis began) and is currently coming close to its end with the range of a price change narrowing down from above. This is probably a continuation pattern that will result in a bearish breakout. Click on the image to get a larger picture:
If you have any questions or comments regarding this USD/CHF chart pattern, please, feel free to reply below.