Breaking News
- December 21, 2020 Do we get tax benefits on Personal Loan?
- December 18, 2020 The solicitors Preston depends on for stress-free compensation claims
- December 16, 2020 eToro: History and Key Features
- December 11, 2020 Canadian Dollar Pauses 2020 Rally Against US Peer Amid Falling Crude Prices
- December 11, 2020 Pound Crashes Against Dollar As No-Deal Brexit Appears Imminent
- December 11, 2020 USD/JPY 104.57 High Starting a New Bearish Leg?
Day: September 20, 2009
 September 20
2009
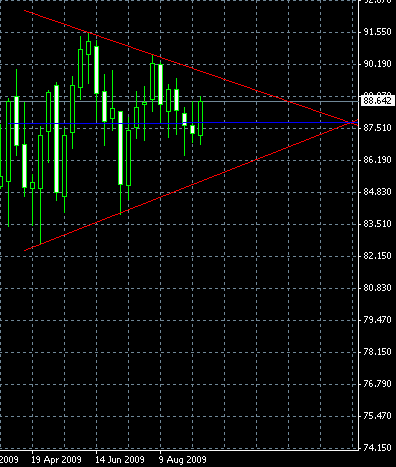
Symmetrical Triangle Chart Pattern on CHF/JPY
Almost a month has passed since the last time I’ve posted the chart pattern analysis here. Today I offer a rather clear symmetrical triangle pattern on CHF/JPY chart at a weekly timeframe. The apex of the triangle is still quite far in time and the early breakouts could probably be false, but a full breakout after 3–4 weeks may signal a good bullish or bearish trading opportunity. The bullish breakout is more probable […]
Read more