
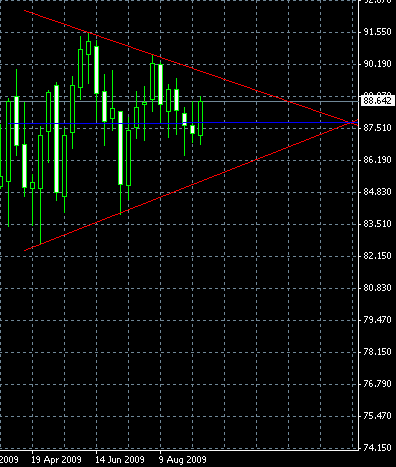
Almost a month has passed since the last time I’ve posted the chart pattern analysis here. Today I offer a rather clear symmetrical triangle pattern on CHF/JPY chart at a weekly timeframe. The apex of the triangle is still quite far in time and the early breakouts could probably be false, but a full breakout after 3–4 weeks may signal a good bullish or bearish trading opportunity. The bullish breakout is more probable since the symmetrical triangle is a continuation pattern. Click the image below to see the full-size chart:
If you have any questions or comments regarding this CHF/JPY chart pattern, please, feel free to reply via the form below.