Gold Bubble — Technical View

The last time I’ve written about the gold bubble was almost a year ago when the commodity has been trading near its all-time high at $941/ounce. Since then, the gold managed to reach a new historical maximum at $1,226/ounce and retrace to near $1,050/ounce. So, what’s the current situation with it? Is it still a bubble? Is it already bursting? Is gold going to go up even higher? When will the gold bubble burst?
Unfortunately, there are no simple answers to these questions. Ask a gold bull or an average Joe and they will say that the gold is going to go up as the economy is tumbling and the paper money is worthless, while the gold has always been a real measure of value. Ask a dollar bull or a gold pessimist and they will say that the commodity has no future as the economy is going to recover soon, that the inflation is nonexistent and the gold is useless as a commodity. But today I’ll try to look at gold from the technical point of view.
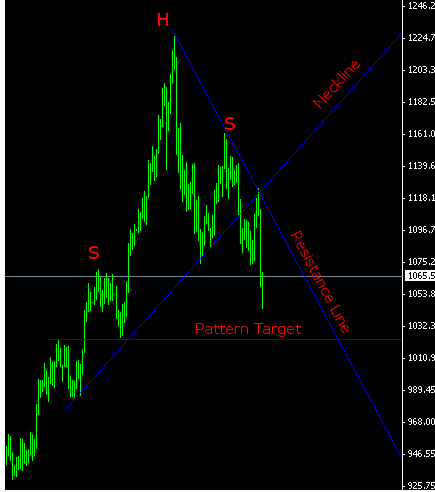
The chart below shows the daily chart of the spot gold from August 2009 until now. It includes the head-and-shoulders pattern that has started forming since October 6 and has ended its formation on January 20, 2010. The “shoulders” are marked with the letter “S” and the head is marked with letter “H”. The neckline is sloped because this “head-and-shoulders” pattern is bullish. The pattern broke out down on January 21. The gold continued to form a sloped resistance line, which now contains three price spikes. The probable target for this pattern breakout lies at the basement of the first shoulder:

The key level on the chart is the pattern breakout target that is located at $1,023/ounce. That lne can be reached during the next 7 weeks even if the gold is going to continue retracing to the resistance slope from time to time.
From the technical point of view this is a perfect pattern breakout, but what does a retracement to ~$1,023 means for gold in a long-term perspective? Is it a bubble burst? Definitely not. Of course, it may serve as a first step in a serious trend change or even may end in a steep drop to some years’ lows, but the pattern itself doesn’t mean a lot in a long-term perspective. I suggest watching closely for what happens next after the pattern is played out and the new technical data becomes available.

If you have any questions or comments regarding the future of the gold, please, feel free to reply via the form below.

Leave a Reply

Your email address will not be published. Required fields are marked *

ninety nine − 90 =