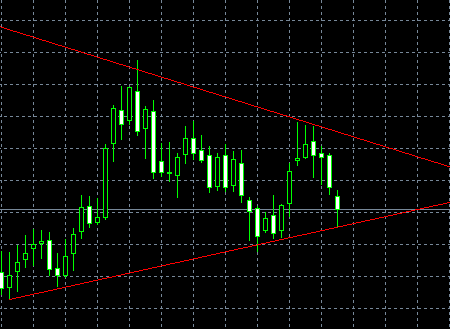
An almost perfect symmetrical triangles pattern has formed on the EUR/GBP weekly chart recently. The consolidation is clearly visible and follows the previous uptrend that has ended in December 2008. A breakout from this pattern may signal a beginning of the next long-term trend. A continuation breakout (bullish) is more probable in this case, but it’s better to wait for the clear signal. The price is quite close to the triangle’s apex, suggesting that the culmination is near. The are only two problems with this pattern: the spikes in the middle (both upward and downward) get out of the borders and a little downward slope of the triangles. These deviations are insignificant, in my opinion, and won’t cause any troubles for the traders. You can click the image below to see the full-size chart:
If you have any questions or comments regarding this EUR/GBP chart pattern, please, feel free to reply via the form below.