
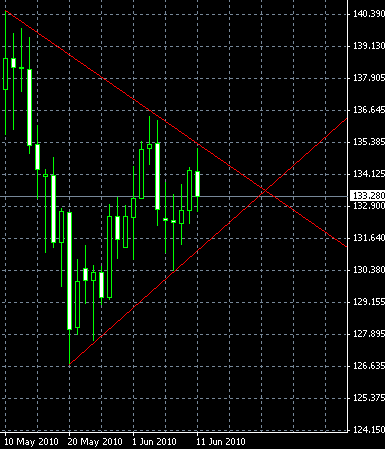
The chart pattern of symmetrical triangles has formed on GBP/JPY daily chart. It has an almost perfect symmetry and more than enough spikes both up and down to confirm its two sloping limits. And the current price is quite close to the apex, so the breakout can be expected soon. It’s a continuation pattern that will most likely result in a new bearish wave. The probable target for these symmetrical triangles is near 126.63 (the horizontal line that goes through the lower corner). You can click the image below to get a
If you have any questions or comments regarding this GBP/JPY chart pattern, please, feel free to reply via the form below.