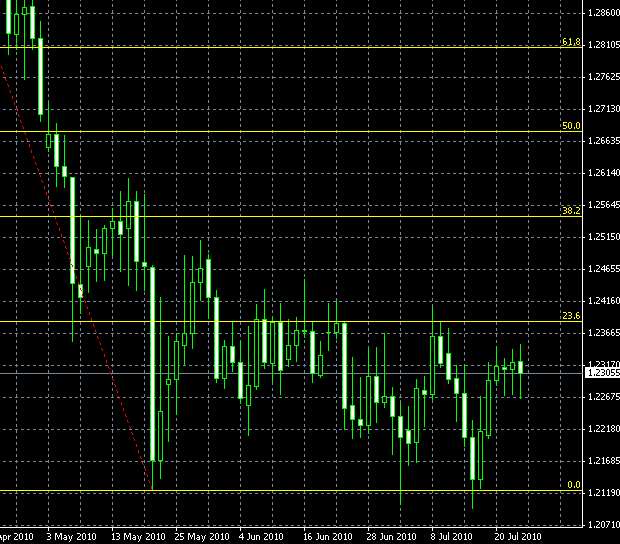
The AUD/NZD daily chart shows an interesting situation appearing since June 1st. The currency pair is trading inside the range formed by 0% and 23.6% levels of the Fibonacci retracements drawn for the last bearish trend. The range channel isn’t very strict as there are both upward and downward spikes in it but it’s still a definite chart pattern. It’s quite hard to predict the breakout direction, so, it’s better to wait for it to happen before entering a trade. A confirmation of the breakout can be a close significantly above or below the range borders (1.2378 and 1.2128 respectively). Click on the image below to get a full chart of AUD/NZD:

If you have any questions or comments regarding this AUD/NZD chart pattern, please, feel free to reply via the form below.