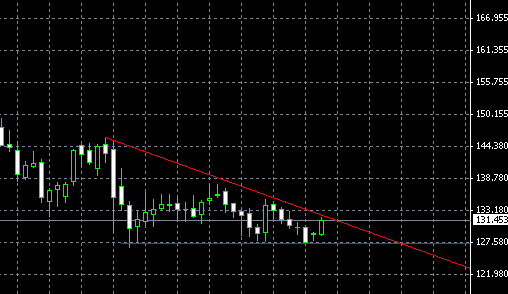
GBP/JPY weekly chart shows a definite descending triangle pattern that was forming since early April and is now approaching its apex. Three price spikes in both directions confirm the borders of the chart pattern. The bearish continuation is more probable but it’s better to wait for the breakout to happen before entering any position. It’s hard to outline any target but we’ll probably see a new

If you have any questions or comments regarding this GBP/JPY chart pattern, please, feel free to reply via the form below.