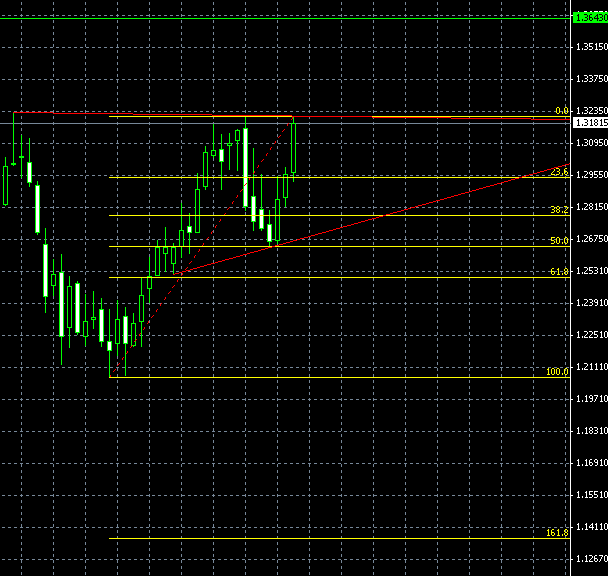
AUD/NZD W1 chart now shows an almost perfect ascending triangle pattern. The pattern was constructed on the trendlines (red lines) built according to Tom DeMark’s rules (I’m currently reading his book, so I’ve tried to apply some of what he says). It’s a rather long-term pattern and the apex of the triangle is quite far away from the current date, but the current price is located very close to the upper boundary of the pattern, which could mean a rather soon breakout. In case of the bullish breakout, the probable target is the 2-decade high of 1.3643 (green line) registered on September 1, 2011. In case of the bearish breakout (very improbable, in my opinion), the target levels are 1.2520, 1.2067 and 1.1364 according to the Fibonacci retracement levels (yellow lines):
If you have any questions or comments regarding this AUD/NZD chart pattern, please, feel free to reply via the form below.