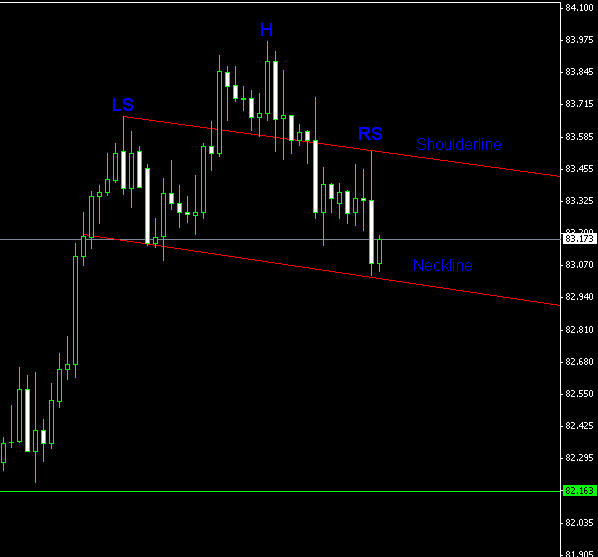
A slightly sloped head-and-shoulders pattern has formed on H4 USD/JPY chart. It still hasn’t broken out but the most probable direction after such patterns is down. In case of a bearish breakout, the probable target is the height of the pattern subtracted from the breakout point. Here, it’s about 86 pips, which if removed from the current low point of the right shoulder, suggests a target of near 82.16 (green line). A safe stop-loss can be placed at the top of the right shoulder (83.52). In case of a pattern failure a strong bullish wave may rise, but the target and the stop-loss level can’t be defined for such scenario. Please click the image for a full-scale screenshot of the chart:
If you have any questions or comments regarding this USD/JPY chart pattern, please feel free to reply via the form below.