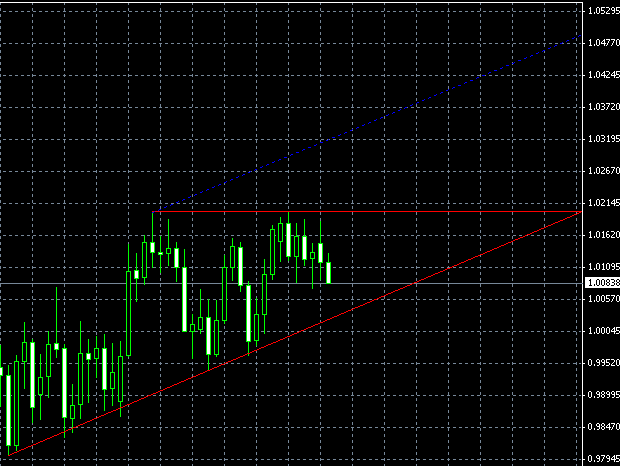
A somewhat flawed ascending triangle patter is currently visible on the AUD/USD D1 chart. Its lower part has started back in mid January and the upper part is from early February. Otherwise it looks very good with the slopes and number of candlewicks touching the forming lines. Since a bullish trend predated the formation of the chart pattern, the bullish breakout should be expected. Adding the height of the triangle to the apex we get a probable target — 1.0487, which is 400 pips above the current price. The apex of this ascending triangle is about 6 weeks ahead, so the breakout shouldn’t be expected too soon. It’s also important to remember that the success probability of this particular triangle can be rather low due to its unconventional form. Use it carefully. You can click the image below for a bigger picture:

If you have any questions or comments regarding this AUD/USD chart pattern, please feel free to reply via the form below.