MetaQuotes added some really nice features to its Strategy Tester tool in the latest build of the MetaTrader 5 platform (build 420). Apart from the usual bug-fixing and some minor changes to the MQL5 coding language, the latest update also presents two completely new but long-awaited features:
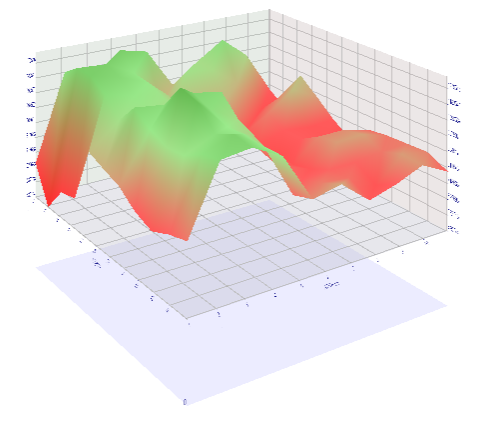
3D visualization of the optimization results is a very useful add-on for every trader and EA developer that uses the optimization feature of the MetaTrader Strategy Tester. It can be viewed if two or more input parameters were used in the optimization process. The Z-scale is the optimization result property (usually, balance or profit), while the X- and Y-scale can be set to one of the input parameters. This way it’s easy to see how the result depends on the input parameters and to interpolate the results for even better input parameters:
Unfortunately, the control over the 3D model inside the strategy tester is very awkward. It can be done with both mouse and keyboard, but it requires some practice before you’ll be able to manipulate the 3D chart at will.
However cool this new feature looks, you should always remember that optimization can lead you to big problems, such as overoptimization of the parameters for a given period.
The second feature isn’t as exciting as the first one, but it also deserves some attention. Apart from the previous 3 types of Strategy Tester execution (Every tick, M1 OHLC data and Open prices only), it’s now possible to select the fourth one — Math calculations. Selecting this type of execution will not use any historical chart data for testing, but the EA functions OnInit(), OnDeinit() and OnTester() will be run, which allows testing of code that doesn’t require any price data.
If you want to comment on the newest features of the MetaTrader 5 Strategy Tester tool, please feel free to reply in the commentary form below.