
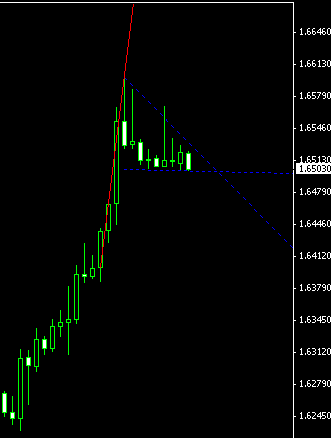
The GBP/USD currency pair has formed a somewhat sloped pennant chart pattern on the H4 chart during
If you have any questions or comments regarding this GBP/USD chart pattern, please feel free to reply via the form below.
The GBP/USD currency pair has formed a somewhat sloped pennant chart pattern on the H4 chart during
If you have any questions or comments regarding this GBP/USD chart pattern, please feel free to reply via the form below.