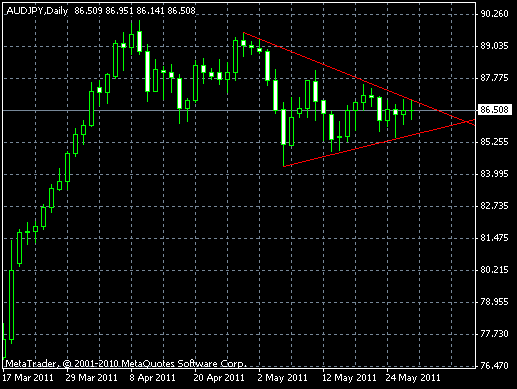
Although what you can currently see on the daily chart of AUD/JPY isn’t a classic example of the symmetrical triangles chart pattern, it’s still worth mentioning, and a potentially profitable trade may spring from it. But the biggest problem is that the previous trend for this pattern isn’t very clear. Immediately before the pattern’s formation, AUD/JPY was falling, but few weeks before, there was a strong bullish trend. As the symmetrical triangles is a continuation chart pattern, it’s not quite easy to decide which breakout to use for trading — upward or downward. In this case, I’d recommend going with the breakout in any direction with a very conservative

If you have any questions or comments regarding this AUD/JPY chart pattern, please feel free to reply via the form below.