
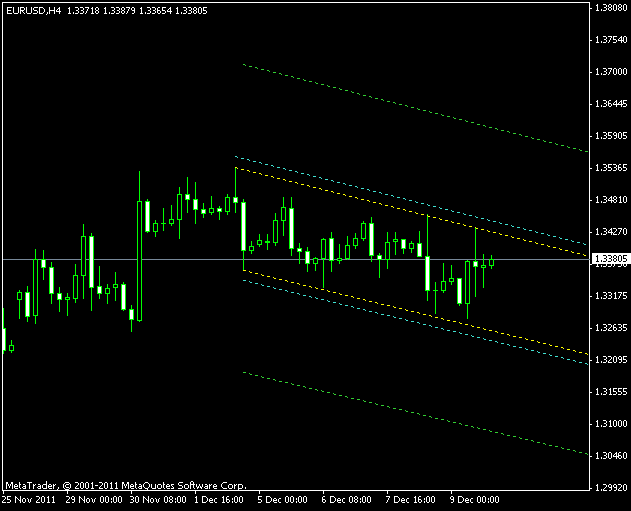
EUR/USD has formed a rather nice sloping channel pattern on the H4 chart. It consists of only 6 trading days but the price has already touched the channel lines 6 times. During the next few days a breakout is possible.
This descending channel is 175 pips high. I would consider a real breakout if the price penetrates a level set at the upper border of the channel plus 10% of channel height (17.5 pips). In case of a breakout, I would set a target level to channel line plus channel height (175 pips). I would use a fixed
Two points to remember about this channel pattern:
Below, you can see the channel chart pattern itself (yellow lines) with my breakout borders (cyan lines) and the probable pattern targets (green lines). You may click the chart image to view a
If you have any questions or comments regarding this EUR/USD chart pattern, please feel free to reply via the form below.