Introduction to Hikkake
I am currently reading the Diary of a Professional Commodity Trader by Peter Brandt and among other good things found a mention of a hikkake pattern there. Hikkake is often called a Japanese candlestick pattern, but in reality it can be used with the common bar chart too as it doesn’t rely on the Open and Close levels.
Hikkake was first described by the famous commodities trader Daniel Chesler in April 2004 article in the Active Trader magazine. Hikkake translated from Japanese means “to trap” or “to ensnare”. It’s a false breakout pattern that tries to work out the failed inside day pattern. It’s both continuation and reversal pattern in terms that it can be met inside a bullish/bearish trend and offer a buy/sell trade opportunity; it can also be met inside a bullish/bearish trend and offer a sell/buy trade opportunity.
Hikkake Details
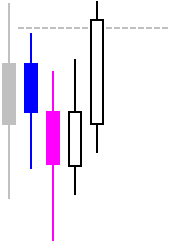
The pattern consists of 2 bars (though the first one also relies on a previous bar). The first bar (blue one, on the images below) is the inside bar — its high should be lower than the previous bar’s high and its low should be higher than the previous bar’s low. The second bar (magenta) should have either higher high and higher low for a bearish hikkake or lower low and lower high for a bullish hikkake. These two bars offer a hikkake setup, which is triggered if any of the next 3 bars breaks through the high of the inside bar (for a bullish hikkake) or through its low (for a bearish hikkake):

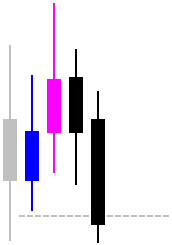
The shown patterns demonstrate a breakout line (dashed), which is violated by the second bar after the pattern is completed, triggering the trade signals.
As you see on the chart, the direction of the bars (Open/Close relation) doesn’t matter. Hikkake pattern is particularly good for Forex traders because it doesn’t take into account the Open/Close of the candles, which offers unspoiled performance in the foreign exchange market, which closes and opens only once a week.
Trading
Trading strategy involving the hikkake pattern is evident from the above examples. A trader sets up a pending stop entry order near the inside bar’s high or low. The
Hikkake Trading Examples
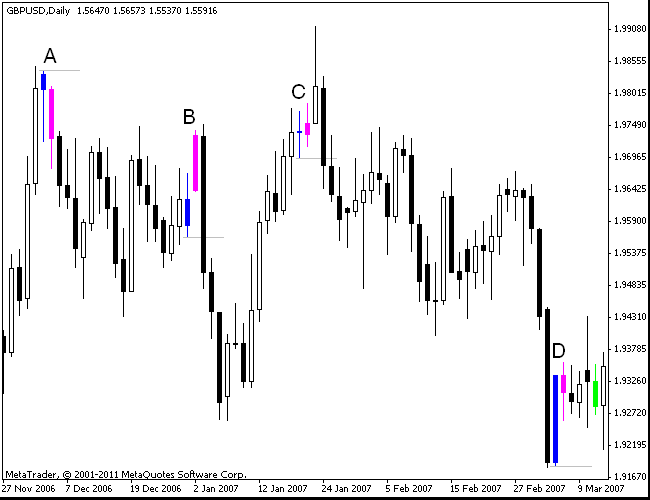
Let’s look at some real life examples of the hypothetical hikkake trades. The inside bars are colored blue, the second hikkake bars are colored with magenta. Bright green bars are the inside bars that weren’t followed by a higher high + higher low or lower low + lower high bars and thus didn’t form a valid hikkake.
The examples shown on the first chart are from the November 2006 — March 2007. I didn’t try to
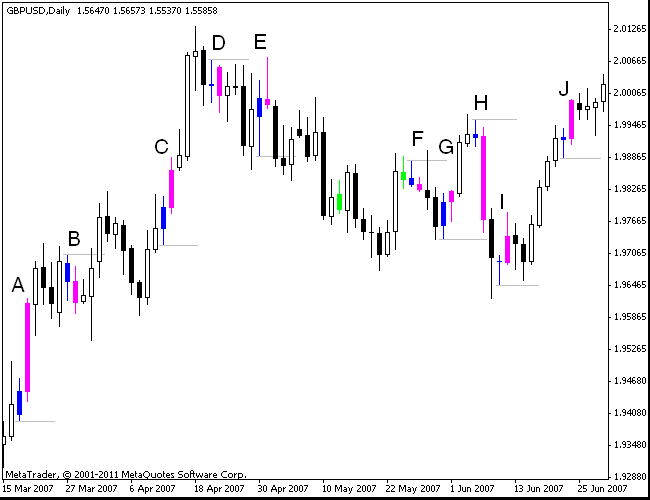
The second chart shows examples from
Conclusion
Hikkake is far from being a
If you have any questions or comments regarding the hikkake chart pattern, please feel free to reply via the form below.