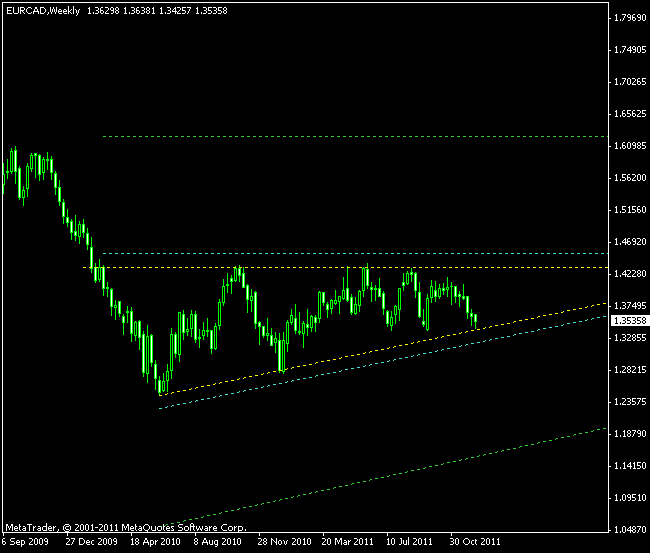
Ascending triangle is one of the best trend continuation patterns. The one has recently formed on the EUR/CAD weekly chart. It’s lasting from February 2010 and can boast 7 touching points of price with the pattern’s borders. There’s one significant problem with this pattern though — it’s formed at the end of the bearish trend, while the classical ascending triangle should trigger a bullish continuation. That’s why I offer two breakout models for this pattern — bullish and bearish.
The initial height of the triangle should be used to form the trading levels for this pattern. In this case, the height is 1,897 pips. The targets are formed by applying this level to the borders of the triangle. The bullish target will remain horizontal, while the bearish target is ascending with the pattern’s lower border. The breakout points are formed similarly, but use 10% of height (190 pips) instead of whole.
Look below for the triangle pattern outlined with yellow lines. Breakout levels and corresponding target levels are shown with the cyan and green lines, respectively. You can also click the image to see the

If you have any questions or comments regarding this EUR/CAD chart pattern, please feel free to reply via the form below.