
Following the success of the channel pattern formed on EUR/USD H4 chart last week, the price has created another channel opportunity for Forex traders. The new descending channel is quite long — it begins on November 1st, and the borders of the pattern have been confirmed 9 times already.
It’s a slightly widening channel, but it still can produce a rather reliable trading signal. The pattern is 373 pips high. The breakout levels are usually set to 10% of height (37.3 pips in our case) to the actual borders of the channel. A profit target is usually set as the border plus (or minus for bearish breakout) the pattern’s height (373 pips in our case). As you probably know, it’s recommended to use pending orders to enter such breakout trades.
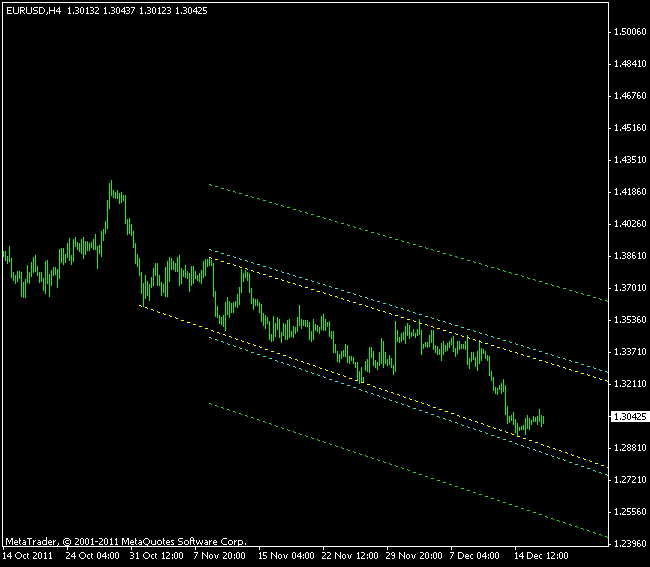
The chart pattern is shown on the image below. The yellow lines show the channel borders; the cyan lines show my 10% breakout levels, while the green lines are the
If you have any questions or comments regarding this EUR/USD chart pattern, please feel free to reply via the form below.