
CAD/CHF is a pretty exotic currency pair and I personally haven’t ever opened a single position on it. But currently I see a good opportunity to start trading this pair — a double top formation on H4 chart. The figure is reliable on
I use 10% levels of the pattern’s height (198 pips) as the pending stop entry levels. As the double top pattern is a trend reversing signal, a downward breakout should be expected, but, if it’s not triggered and the price moves up, a pattern may transform into a horizontal channel. That’s why an upward breakout opportunity should also be watched. I set the breakout levels to pattern’s borders minus/plus 10% of height (20 pips). The expected profit level is equal to the pattern’s height.
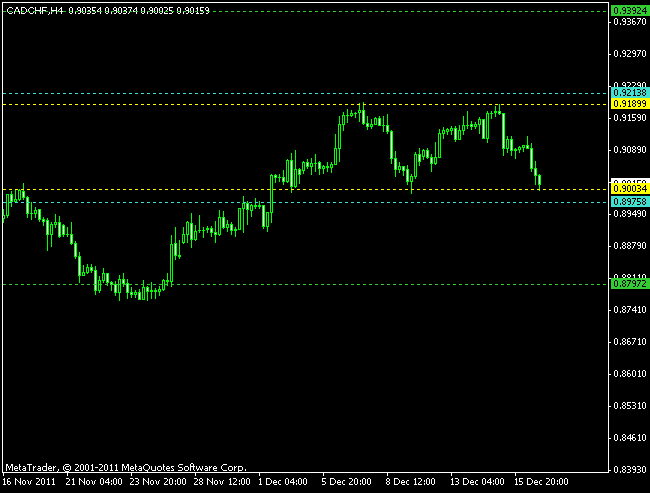
Please see the chart with a double top pattern below. The yellow lines show the borders of the pattern; the cyan lines show the breakout levels, and the green lines are used to show the profit targets. Don’t forget to click on the chart if you want to see the larger version:
If you have any questions or comments regarding this CAD/CHF chart pattern, please feel free to reply via the form below.