
Another ascending triangle pattern can be easily seen on the EUR/CHF daily chart, unlike the one of the EUR/CAD chart, this one is actually continuing the previous bullish trend. The problem with this pattern is the fact that the latest lower border point is formed by the low of the latest trading session, which isn’t reliable at all.
The initial height of the pattern is 412 pips, which added to the upper border becomes the
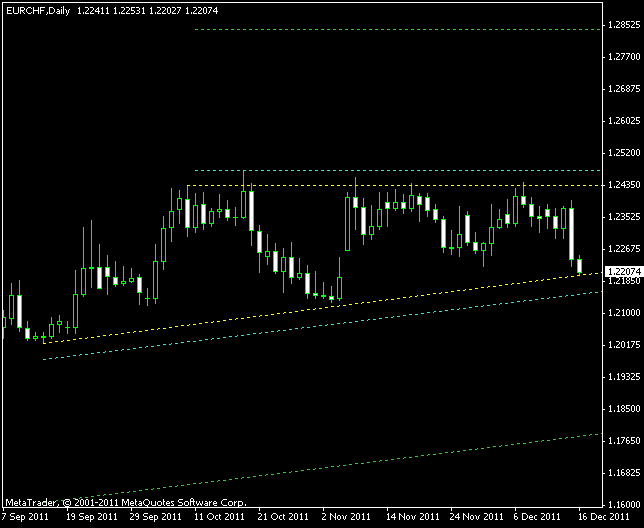
Below is the screenshot of the pattern with the ascending triangle’s borders (yellow lines), expected breakout level (cyan line) and the probable target (green line). Downward breakout and target levels are shown for reference only. Click the image to see its increased size version:
If you have any questions or comments regarding this EUR/CHF chart pattern, please feel free to reply via the form below.