
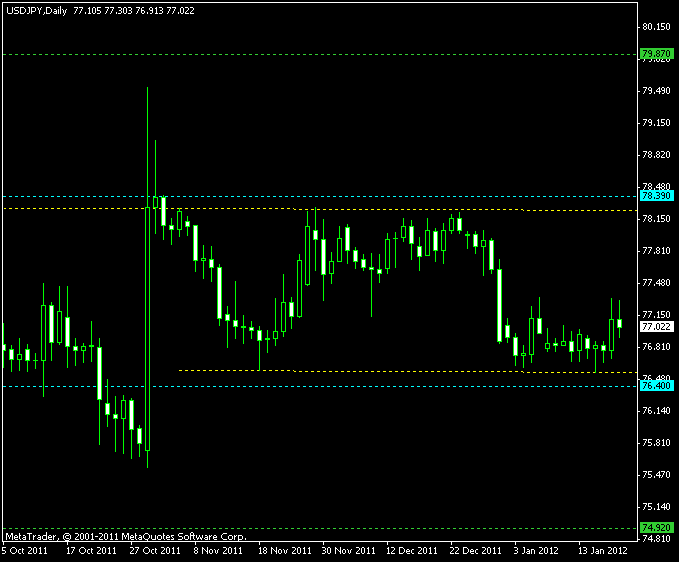
A channel pattern has formed on the daily chart of the USD/JPY currency pair. While it’s not exactly horizontal, it can be traded as such without a problem because the slope is almost unnoticeable. The price has touched both top and bottom borders of the channel 3 times.
I set my entry stop orders (cyan lines) at borders (yellow lines) + 10%: 78.39 for long and 76.40 for short. The targets (green lines) are the height of the channel (165 pips) added to the borders: 79.87 for long positions and 74.92 for short positions.
If you have any questions or comments regarding this USD/JPY chart pattern, please feel free to reply via the form below.