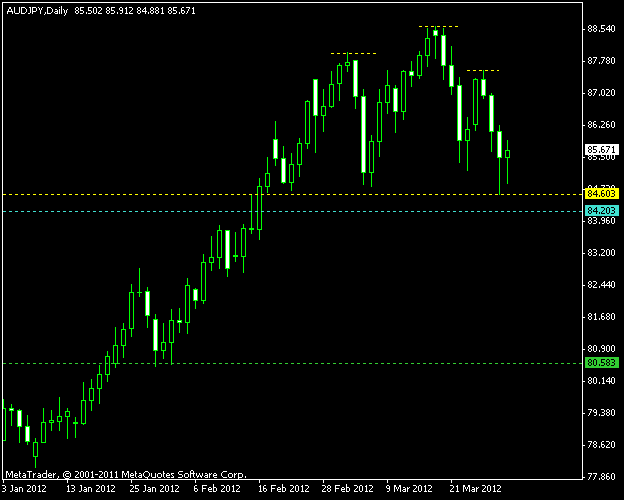
Forex traders can spot a really interesting head-and-shoulders chart pattern on the daily AUD/JPY chart today. There are several good reasons to pay attention to this particular formation. Head-and-shoulders is a strong trend reversal signal and the current pattern is topping a rather strong upward wave. The pattern is also 6 weeks wide, which means that it’s a fully formed medium-term signal. Thirdly, the right shoulder’s height is less than the left shoulder’s height, which stresses the bearishness of the whole pattern. Lastly, the right shoulder spans over 6 days, while the left shoulder spans over 13 days — this means that it took bears half as much time to drop the prices as it took bulls to raise them.
The short yellow lines mark the head and two shoulders of the pattern. The long horizontal yellow line is the pattern’s neckline. Despite the obvious strength of this pending signal, some caution is required for entering a trade. The cyan line marks the 10% buffer zone for entering a short trade, while the green line is my usual profit target, which is directly derived from the pattern’s height. I will set my stop-loss at the high of a breakout daily bar. Don’t forget that you can click the image for a larger screenshot of the current AUD/JPY chart: Update 2012-04-04: Short position opened at 84.20 with stop-loss level at 85.64 and take-profit at 80.58. Update 2012-05-08: Position closed at take-profit level of 80.57 (a positive slippage of 1 pip compared to the initial TP level). AUD/JPY continued down below my target.
If you have any questions or comments regarding this AUD/JPY chart pattern, please feel free to reply via the form below.