After a
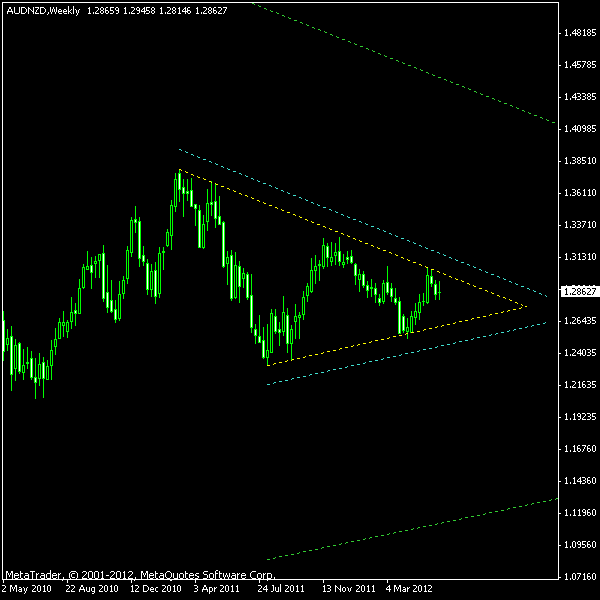
Please refer to the chart below to see the pattern (yellow lines), breakout entry levels (cyan lines) and the moderately conservative targets (green lines). Although the pattern is not ideal in a sense that the lower triangle has a little stronger slope than the upper one, the formation was confirmed by many price spikes, which prove its validity. In my opinion, the most probable breakout direction here is up as the symmetrical triangles tend to breakout to the previous trend’s direction, which is clearly ascending. I will use the breakout bar’s low as the

Update 2012-07-25: Buy stop order triggered at 1.3080.
Update 2012-08-24:
If you have any questions or comments regarding this AUD/NZD chart pattern, please feel free to reply via the form below.