A long-term descending trend on GBP/NZD is about to end in a double bottom pattern, which has started to form back in May 2011. The pattern is accompanied by a pullback from its top border — it is not unusual for the double top/bottom formations to produce such pullbacks before a final breakout. So in this case I will disregard this “warning sign”.
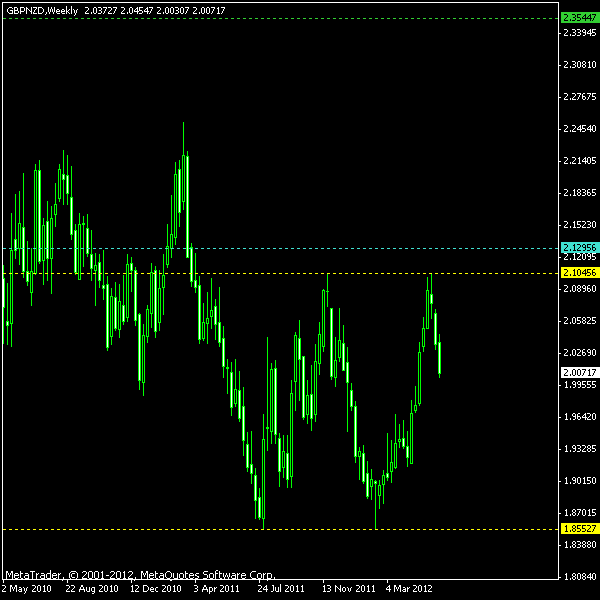
You can see the borders of this Forex formation marked with the yellow lines on the chart below. The cyan line is the breakout point for a bullish direction. It is placed 10% of the pattern’s height above the yellow line. The green line is my profit-taking target located at 100% of the pattern’s height above the yellow line. I will consider only an upward breakout with this double bottom. As always, you can click on the chart below to get a full-size image:
If you have any questions or comments regarding this GBP/NZD chart pattern, please feel free to reply via the form below.