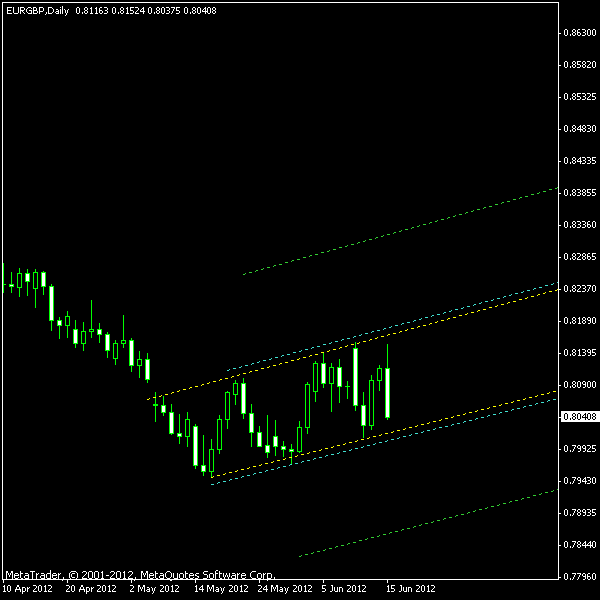
The daily chart of EUR/GBP currency pair is currently showing a completely formed ascending channel pattern. Its formation began on May 7 this year after a tremendous weekly price gap, so the channel stands out of the rest of chart bars quite clearly. Also, there were at least four upper and three lower border confirmations.
The image below depicts the current EUR/GBP pattern marked with the yellow lines. The cyan lines show the potential entry points for breakout trading, while the green ones are the profit targets in case of a breakout.

You can also download my MetaTrader 4 chart template for this EUR/GBP pattern.
If you have any questions or comments regarding this EUR/GBP chart pattern, please feel free to reply via the form below.