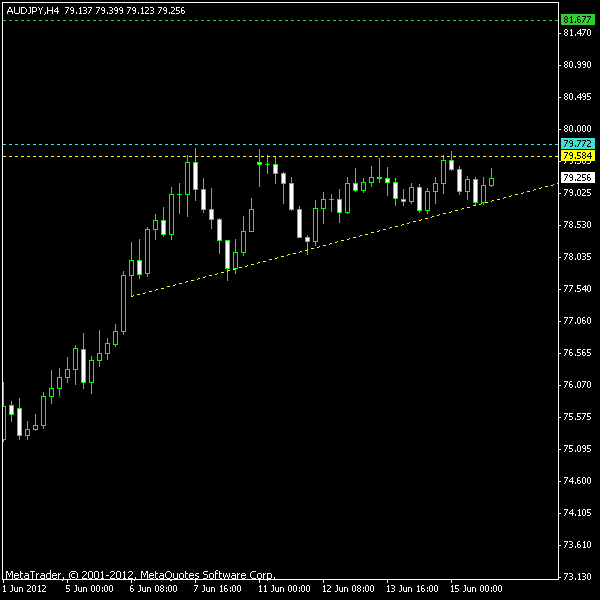
An ascending triangle of a rather rough form is being displayed by the H4 AUD/JPY chart now. The triangle services as a continuation signal for the bullish wave started back on June 1. A bearish breakout is not recommended for trading in case of the ascending triangle Forex pattern.
Please see the screenshot of the AUD/JPY chart below. The yellow lines show the triangle’s borders. The horizontal cyan line is a

You can also download my MetaTrader 4 chart template for this AUD/JPY ascending triangle.
Update 2012-06-18: Missed initial entry point, entered on a
Update 2012-06-29: Position exited at profit target of 81.67 as planned.
If you have any questions or comments regarding this AUD/JPY chart pattern, please feel free to reply via the form below.