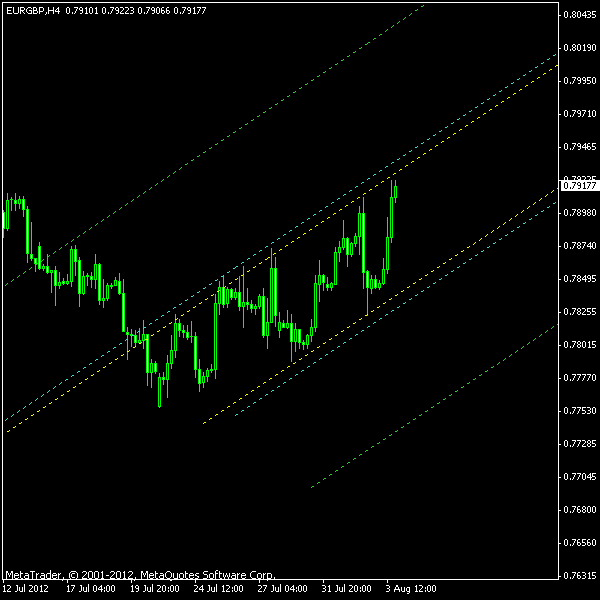
Following the June daily chart ascending channel with a nice breakout outcome, EUR/GBP is now presenting another similar pattern — this time on a 4-hour chart. The top border of the channel is active since July 20, while the bottom one became a support level on July 30. As with all the ascending channels, a bearish breakout should be expected for a
The yellow lines show the actual channel on the screenshot below, while the cyan ones show the breakout entry levels with some

You can also download my MetaTrader 4 chart template for this EUR/GBP pattern.
Update 2012-08-08: Opened short at 0.7883 with a
Update 2012-08-15: Position closed with profit at 0.7856. Unfortunately the reward/risk ratio was extremely poor here — at about 0.4 — due to the ascending TP line.
If you have any questions or comments regarding this EUR/GBP chart pattern, please feel free to reply via the form below.