Breaking News
- December 21, 2020 Do we get tax benefits on Personal Loan?
- December 18, 2020 The solicitors Preston depends on for stress-free compensation claims
- December 16, 2020 eToro: History and Key Features
- December 11, 2020 Canadian Dollar Pauses 2020 Rally Against US Peer Amid Falling Crude Prices
- December 11, 2020 Pound Crashes Against Dollar As No-Deal Brexit Appears Imminent
- December 11, 2020 USD/JPY 104.57 High Starting a New Bearish Leg?
Day: September 16, 2012
 September 16
2012
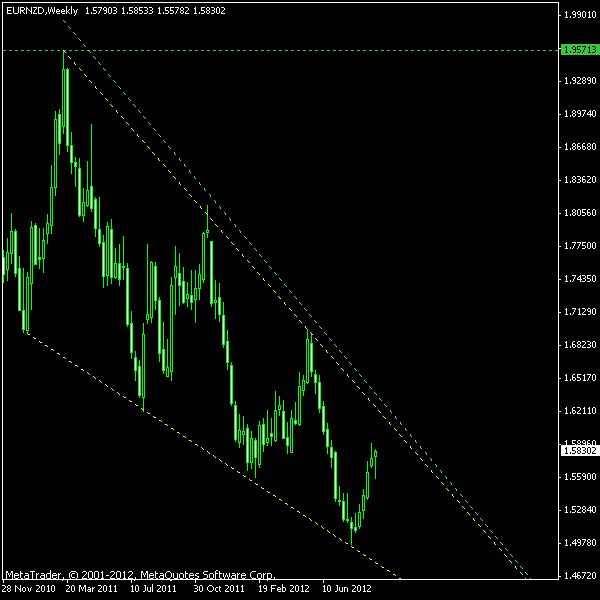
Falling Wedge on Weekly Chart of EUR/NZD
If you look at the weekly chart of the EUR/NZD currency pair you will easily spot a pattern known as a falling wedge. The current instance of the pattern is completely valid with 4 touches of the lower border and 3 touches of the upper border. It is a very long-term pattern that has started forming back in January of the the year 2011. Falling wedges are usually followed with bullish breakouts with a rather high […]
Read more