
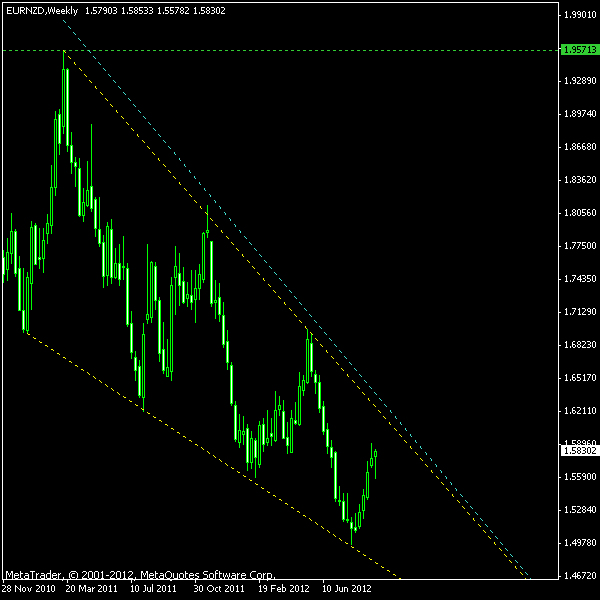
If you look at the weekly chart of the EUR/NZD currency pair you will easily spot a pattern known as a falling wedge. The current instance of the pattern is completely valid with 4 touches of the lower border and 3 touches of the upper border. It is a very
The image below depicts the EUR/NZD wedge. The yellow lines show the borders of the pattern. The cyan line is the entry level that is calculated as 10% of the pattern’s height (which is varying, of course) added to the top border. I will use it to enter a long position and I will ignore any bearish breakouts. The profit target is given as the highest point of the formed wedge and is marked with a green line on the image. My
You can also download my MetaTrader 4 chart template for this EUR/NZD pattern.
Update 2012-10-16: Long entry triggered at 1.60555 with
Update 2012-10-25:
Update 2012-10-25 #2: Just noticed that my entry level was placed at the border (yellow line) instead of the “buffer zone” (cyan line). Oh well, got to hate losing to wrongly entered data…
Update 2012-12-03 08:15 GMT: Unfortunately, missed the entry on breakout, which occurred about 10 hours ago. Set a
Update 2012-12-03 11:48 GMT: Long position triggered on
Update 2012-12-06 16:23 GMT: Got stopped out more than an hour ago. No slippage. I guess the pattern is done. I do not see the breakout spike as a new high point of the falling wedge. Well, there will be other patterns…
If you have any questions or comments regarding this EUR/NZD chart pattern, please feel free to reply via the form below.